Stock Market Performance: Key Insights and Trends You Need to Know - May 2026
Discover the latest stock market trends and key performance indicators for top companies like Apple, Microsoft, and Google. Stay ahead with expert insights into stock performance and analysis.
by Kowsalya
Published May 14, 2026 | Updated May 14, 2026 | 📖 4 min read
Article continues below advertisement

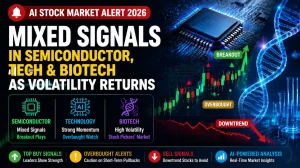
As we move into mid-2026, understanding the performance of major stocks is essential for investors and market enthusiasts. From tech giants like Apple and Microsoft to emerging stars in other sectors, the stock market is full of opportunities. This article takes a deep dive into the performance indicators of top stocks, including RSI, MACD, and trend signals, to help you make informed decisions.
AI Overview: Key Insights from Stock Performance Data
The stock market is driven by a variety of technical indicators that help investors assess the health of individual stocks. Some of the most valuable indicators include:
- RSI (Relative Strength Index): Shows whether a stock is overbought or oversold.
- MACD (Moving Average Convergence Divergence): Helps to spot trends and trend reversals.
- Trend Indicators: Used to evaluate whether a stock is in an uptrend, downtrend, or range-bound.
By understanding these indicators, you can gauge the performance potential of stocks like Apple (AAPL), Microsoft (MSFT), and others, each presenting different investment opportunities.
Apple (AAPL) Stock Analysis: Bullish Momentum Continues
- Price: $298.87 (+1.38%)
- RSI: 75.6 (Overbought)
- MACD: 2.04 (Bullish)
- Trend: Trending Up
Apple’s stock has seen positive movement in May 2026, showing a strong uptrend with RSI at 75.6, indicating that it is overbought but continuing to rise. The MACD signal is bullish, further confirming the strength of this trend. This stock could be a great pick for trend-following investors, especially those looking for long-term growth.
Microsoft (MSFT): A Slight Decline with Neutral Outlook
- Price: $405.21 (-0.63%)
- RSI: 47.3 (Neutral)
- MACD: -2.30 (Bearish)
- Trend: Ranging
Microsoft is currently showing a slight decline with a -0.63% change in price, and its RSI of 47.3 suggests a neutral market position. The MACD indicator is bearish, signaling that there might be downward pressure in the near term. Investors looking for stability may consider holding their position, but those seeking momentum might want to explore other options.
Google (GOOGL): A Strong Buy Signal with Strong Bullish Momentum
- Price: $402.62 (+3.94%)
- RSI: 75.6 (Overbought)
- MACD: 1.59 (Bullish)
- Trend: Trending Up
Google’s stock has shown impressive growth with a +3.94% increase in price. The RSI of 75.6 suggests it is nearing overbought territory, but the bullish MACD and uptrend signals continue to drive momentum. This strong buy signal makes Google a promising stock for those looking to capitalize on upward trends.
Stock Performance Comparison Table for May 2026
| Stock | Price | Change (%) | RSI | MACD | Trend | Recommendation |
|---|---|---|---|---|---|---|
| Apple | $298.87 | +1.38% | 75.6 | 2.04 | Trending Up | Strong Buy |
| Microsoft | $405.21 | -0.63% | 47.3 | -2.30 | Ranging | Hold |
| $402.62 | +3.94% | 75.6 | 1.59 | Trending Up | Strong Buy |
Stock Performance Indicators: What They Tell You
The Relative Strength Index (RSI) helps investors determine if a stock is overbought (above 70) or oversold (below 30). High RSI levels, like Apple and Google, may signal that the stock is due for a price correction, but they can also indicate strong upward momentum in a trending market.
Meanwhile, the MACD indicator provides valuable insight into trend reversals. Stocks with positive MACD values, such as Apple and Google, are often seen as favorable for growth investors, whereas negative MACD values, like Microsoft, might indicate bearish market conditions.
Expert Tips: What to Do with This Data?
- Trend Following: If you’re looking for stocks in strong uptrends, Apple and Google should be on your radar.
- Neutral Markets: Microsoft’s neutral market condition suggests that a wait-and-see approach might be best for those who prefer low-risk, steady stocks.
- Diversification: Even with strong bullish indicators, remember to diversify your portfolio to mitigate risks and balance out any overbought positions.
Conclusion: The Road Ahead for Top Stocks
As the stock market evolves in May 2026, it’s important to stay informed on the performance of major companies. Apple and Google are showcasing bullish trends, while Microsoft remains neutral. By using key indicators like RSI, MACD, and trend signals, investors can make more informed decisions to navigate the stock market effectively.
Disclaimer: The information provided in this article is for educational and informational purposes only and should not be construed as financial or investment advice. The stock market is inherently volatile, and the past performance of any stock or investment does not guarantee future results. Always conduct thorough research or consult a financial advisor before making any investment decisions. The author and Marketshost.com are not responsible for any losses incurred from the use of this information.
Related Articles
Disclaimer : The above information is for general informational purposes only. All information on the Site is provided in good faith, however we make no representation or warranty of any kind, express or implied, regarding the accuracy, adequacy, validity, reliability, availability or completeness of any information on the Site.