Stock Performance Analysis: Key Insights for Top Tech Stocks in May 2026
Discover the latest stock performance trends for major companies like Apple, Microsoft, and Google in May 2026. Explore detailed insights into RSI, MACD, and other key indicators to stay ahead of the market.
by Kowsalya
Published May 14, 2026 | Updated May 14, 2026 | 📖 4 min read
Article continues below advertisement

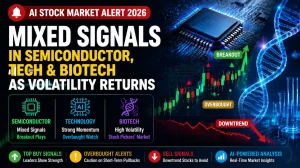
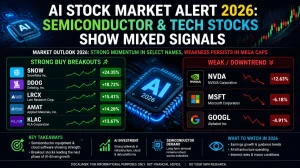
The stock market continues to present intriguing opportunities in May 2026. As investors evaluate the performance of top companies like Apple (AAPL), Microsoft (MSFT), and Google (GOOGL), several indicators are guiding decisions, including RSI (Relative Strength Index), MACD (Moving Average Convergence Divergence), and overall trends. In this article, we’ll break down the latest data and technical indicators, offering a closer look at how these stocks are poised for future growth or risk in the near term.
AI Overview: Understanding Key Stock Indicators
When evaluating stocks, investors rely on several key indicators that can signal whether a stock is in an uptrend, downtrend, or neutral position. These include:
- RSI (Relative Strength Index): A measure of whether a stock is overbought or oversold. A value over 70 indicates the stock may be overbought, and below 30 indicates oversold conditions.
- MACD (Moving Average Convergence Divergence): Used to identify momentum trends and potential reversals.
- Trend Analysis: Identifies whether the stock is in an uptrend, downtrend, or neutral, helping investors decide when to buy, hold, or sell.
Apple (AAPL): Bullish Momentum with Strong Buy Signals
- Price: $298.87 (+1.38%)
- RSI: 75.6 (Overbought)
- MACD: 2.04 (Bullish)
- Trend: Uptrend
Apple continues its upward momentum in May 2026 with a notable 1.38% price increase. Despite an overbought RSI of 75.6, the stock remains in a strong uptrend, with the MACD showing bullish movement. For investors, Apple offers a strong buy signal, confirming its position as a top performer in the tech sector.
Microsoft (MSFT): Neutral Market with Bearish Pressure
- Price: $405.21 (-0.63%)
- RSI: 47.3 (Neutral)
- MACD: -2.30 (Bearish)
- Trend: Ranging
Microsoft's stock has experienced a slight decline of 0.63% in May, with an RSI of 47.3 indicating a neutral market position. The negative MACD reading further points to bearish momentum. Investors should approach Microsoft cautiously, as it faces downward pressure, suggesting a "wait-and-see" strategy for now.
Google (GOOGL): Strong Buy Signal with Bullish Momentum
- Price: $402.62 (+3.94%)
- RSI: 75.6 (Overbought)
- MACD: 1.59 (Bullish)
- Trend: Uptrend
Google (GOOGL) shows impressive performance, with a 3.94% increase in its stock price. Although its RSI suggests overbought conditions, the bullish MACD and strong uptrend point to continued growth potential. This stock remains a strong buy for investors who are looking to capitalize on its bullish trajectory.
Stock Performance Comparison Table for May 2026
| Stock | Price | Change (%) | RSI | MACD | Trend | Recommendation |
|---|---|---|---|---|---|---|
| Apple | $298.87 | +1.38% | 75.6 | 2.04 | Uptrend | Strong Buy |
| Microsoft | $405.21 | -0.63% | 47.3 | -2.30 | Ranging | Hold |
| $402.62 | +3.94% | 75.6 | 1.59 | Uptrend | Strong Buy |
Stock Performance Indicators Breakdown
RSI (Relative Strength Index)
RSI is a key indicator for investors. A stock with an RSI above 70 is considered overbought, signaling that it might be due for a price correction. Conversely, an RSI below 30 suggests that the stock could be oversold and might be due for a bounce back. As seen with Apple and Google, the overbought RSI values don’t necessarily mean that the stocks will decline, but it signals that the price could be rising faster than the fundamentals can support.
MACD (Moving Average Convergence Divergence)
MACD helps to spot trend reversals. Positive values, like those seen with Apple and Google, signal upward momentum, while negative values, like Microsoft's, suggest a bearish outlook. Investors should consider MACD readings as a confirmation tool for buying or selling.
Conclusion: What’s Next for Top Tech Stocks?
As May 2026 continues, top stocks like Apple, Google, and Microsoft present varying opportunities. Apple and Google are showing strong bullish trends, making them attractive for growth-oriented investors. On the other hand, Microsoft is in a neutral market condition with some bearish indicators, suggesting caution.
By staying updated with key stock performance indicators like RSI, MACD, and trend analysis, investors can better navigate the market and make informed decisions. Whether you’re a short-term trader or a long-term investor, understanding these technical factors is crucial in maximizing your returns in today’s dynamic stock market.
Disclaimer: The information provided in this article is for informational purposes only and should not be construed as financial or investment advice. The stock market is inherently volatile, and past performance is not indicative of future results. Readers are encouraged to conduct their own research or consult a professional financial advisor before making any investment decisions. The author and Marketshost.com do not accept any liability for losses or damages resulting from the use of this information.
Related Articles
Disclaimer : The above information is for general informational purposes only. All information on the Site is provided in good faith, however we make no representation or warranty of any kind, express or implied, regarding the accuracy, adequacy, validity, reliability, availability or completeness of any information on the Site.