
10 Stocks Showing Strong Buy Signals with High Confidence — August 2026
Explore 10 top-ranked stocks from our August 2026 scanner, featuring Medpace Holdings and ExxonMobil with 100% confidence BUY signals and robust technicals.
by Kowsalya
Published Aug 12, 2026 | Updated Aug 12, 2026 | 📖 11 min read
Article continues below advertisement
OpportunityRadar Uncovers 10 Strong Buy Signals for August 2026
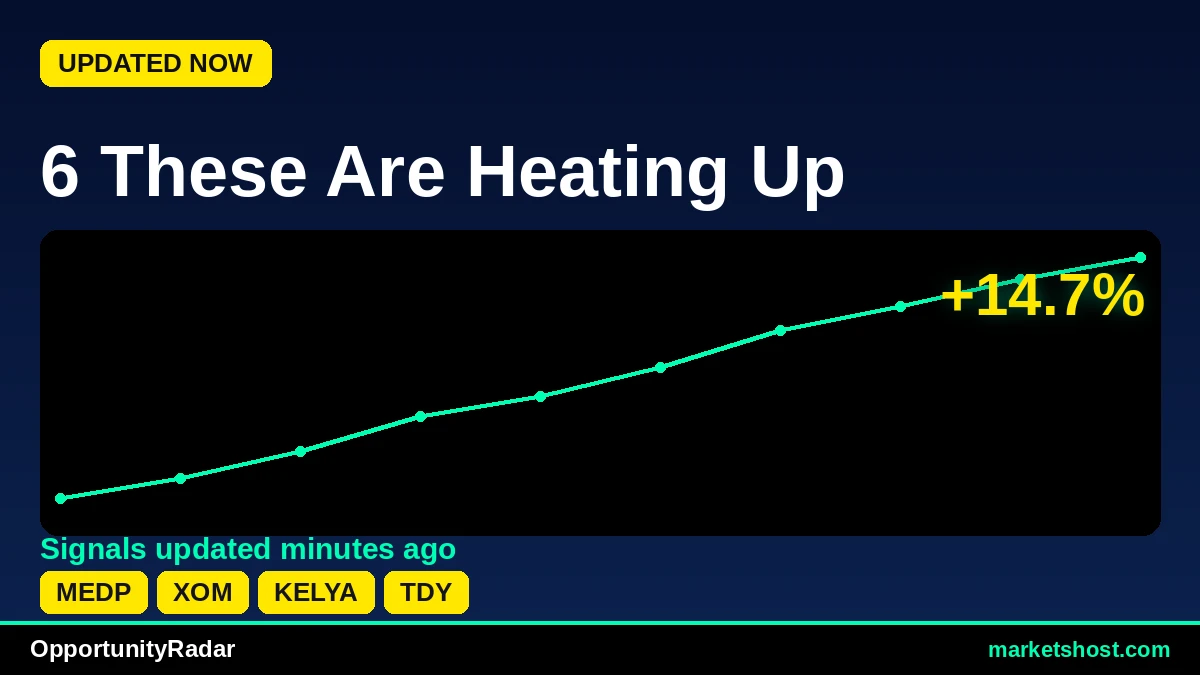
As of August 12, 2026, the MarketsHost.com OpportunityRadar scanner has identified a compelling set of BUY signals, with Medpace Holdings, Inc. (MEDP) and ExxonMobil Holdings Corporatio (XOM) leading the charge among the top-ranked opportunities. Both tickers registered an impressive OpportunityRadar Score of 67, accompanied by a 100% confidence rating and a 'STRONG ENTRY' signal. MEDP, priced at $600.92, shows an RSI of 65.3 and a MACD in BULL territory, having delivered a 1-month return of 13.55% and a 3-month return of 41.81%. XOM, trading at $159.11, also boasts a MACD BULL signal and a robust 1-month return of 10.1%.
Across the initial top 10 tickers flagged by our scanner, a significant trend emerges: eight of these ten signals carry a 100% confidence rating, indicating strong alignment across various confirmation factors. The average Relative Strength Index (RSI) for these top ten opportunities stands at approximately 60.2, suggesting generally healthy momentum without being broadly overbought. While the vast majority, eight out of ten, display a MACD BULL signal, two tickers, Kelly Services, Inc. (KELYA) and World Kinect Corporation (WKC), present a MACD BEAR signal despite their overall BUY recommendation, highlighting areas for closer examination.
Top 10 Signals at a Glance
| # | Ticker | Company | Price | Score | Confidence | RSI | MACD | 1-Month Return |
|---|---|---|---|---|---|---|---|---|
| 1 | MEDP | Medpace Holdings, Inc. | $600.92 | 67 | 100% | 65.3 | BULL | 13.55% |
| 2 | XOM | ExxonMobil Holdings Corporatio | $159.11 | 67 | 100% | 63.4 | BULL | 10.1% |
| 3 | KELYA | Kelly Services, Inc. | $15.26 | 66 | 67% | 56.6 | BEAR | 6.45% |
| 4 | TDY | Teledyne Technologies Incorpor | $681.91 | 66 | 100% | 62.5 | BULL | 9.25% |
| 5 | AMCR | Amcor plc | $46.75 | 65 | 100% | 58.2 | BULL | 7.71% |
| 6 | CRBG | Corebridge Financial Inc. | $33.39 | 65 | 100% | 61.1 | BULL | 4.77% |
| 7 | ICUI | ICU Medical, Inc. | $178.46 | 64 | 100% | 64.7 | BULL | 12.98% |
| 8 | BOX | Box, Inc. | $32.46 | 64 | 100% | 61.0 | BULL | 6.53% |
| 9 | WKC | World Kinect Corporation | $37.06 | 64 | 83% | 52.2 | BEAR | 0.45% |
| 10 | CAH | Cardinal Health, Inc. | $237.07 | 64 | 100% | 57.0 | BULL | 5.39% |
#1: MEDP — Medpace Holdings, Inc.
Medpace Holdings, Inc. (MEDP) leads the current scan with an OpportunityRadar Score of 67, driven by strong technicals rated at 73 and solid fundamentals scoring 58. The scanner has issued a 100% confidence BUY signal, categorizing it as a 'STRONG ENTRY' opportunity at its current price of $600.92. Technical indicators are supportive, showing an RSI of 65.3 and a MACD in BULL territory, both suggesting positive price momentum. The stock has demonstrated robust recent performance, with a 1-month return of 13.55% and an even more impressive 3-month return of 41.81%, indicating sustained upward trajectory.
While the RSI of 65.3 indicates strong momentum, it is approaching the upper bound of 70, which could suggest a stock nearing overbought conditions. This proximity to the overbought threshold potentially warrants careful monitoring for any signs of consolidation or a minor pullback, despite the favorable Risk/Reward ratio of 1.3.
#2: XOM — ExxonMobil Holdings Corporatio
ExxonMobil Holdings Corporatio (XOM) registers an OpportunityRadar Score of 67, reflecting a strong fundamental component of 70 and a technical score of 65. The scanner issues a 100% confidence BUY signal, categorizing it as a 'STRONG ENTRY' opportunity at its current price of $159.11. Technical analysis points to an RSI of 63.4 and a MACD in BULL status, aligning with positive price action. Recent performance includes a 1-month return of 10.1% and a 3-month return of 4.97%, showcasing consistent gains over both periods.
A notable aspect for XOM is its Risk/Reward ratio of 0.6. This indicates that, according to the scanner's calculations, the potential for gain is less than the potential for loss based on the identified stop and target levels. This lower ratio might suggest a less favorable risk-adjusted entry point compared to other opportunities with higher Risk/Reward profiles.
#3: KELYA — Kelly Services, Inc.
With an OpportunityRadar Score of 66, Kelly Services, Inc. (KELYA) is flagged with a BUY signal, though its confidence level is 67%, lower than many peers, leading to an 'ENTRY' rather than 'STRONG ENTRY' recommendation. The technical score is 74, while the fundamental score is 53. The stock, priced at $15.26, has an RSI of 56.6. However, its MACD is in BEAR territory, which presents a divergence from the overall BUY signal. Performance highlights include a 1-month return of 6.45% and a substantial 3-month return of 56.14%, indicating strong longer-term momentum.
The MACD BEAR signal, despite the overall BUY recommendation, suggests that the short-term momentum might be weakening or has already turned negative. This technical divergence, coupled with a lower confidence rating of 67% compared to the 100% seen in other top signals, implies a need for increased scrutiny, even with a favorable Risk/Reward ratio of 2.0.
#4: TDY — Teledyne Technologies Incorpor
Teledyne Technologies Incorpor (TDY) shows an OpportunityRadar Score of 66, with a technical score of 71 and a fundamental score of 58. The scanner has issued a 100% confidence BUY signal and a 'STRONG ENTRY' recommendation for this stock, currently priced at $681.91. Technical indicators are supportive, with an RSI of 62.5 and the MACD firmly in BULL territory, suggesting sustained positive momentum. Its recent price action includes a 1-month return of 9.25% and a 3-month return of 7.22%, reflecting steady gains.
A key factor to consider for TDY is its very low Risk/Reward ratio of 0.2. This suggests that the potential reward, as defined by the scanner's parameters, is significantly smaller than the potential risk. This low ratio could make it a less attractive option for investors prioritizing a higher potential return relative to the inherent risk.
#5: AMCR — Amcor plc
Amcor plc (AMCR) registers an OpportunityRadar Score of 65, supported by a technical score of 69 and a fundamental score of 58. The signal for AMCR is a BUY with 100% confidence, leading to a 'STRONG ENTRY' recommendation at its current price of $46.75. Technical analysis indicates a healthy RSI of 58.2 and a MACD in BULL status, signaling positive price trends. The stock's recent performance includes a 1-month return of 7.71% and a 3-month return of 19.55%, demonstrating solid upward movement over both periods.
Similar to some other entries, AMCR presents a low Risk/Reward ratio of 0.3. This metric suggests that the potential for upside is relatively limited compared to the potential downside, based on the scanner's risk management framework. Investors may need to assess whether this risk-adjusted profile aligns with their investment objectives.
#6: CRBG — Corebridge Financial Inc.
Corebridge Financial Inc. (CRBG) has an OpportunityRadar Score of 65, with its technical score at 69 and fundamental score at 58. The scanner has identified a BUY signal for CRBG, backed by a 100% confidence rating and a 'STRONG ENTRY' recommendation. The stock is currently trading at $33.39. Technical indicators are aligned, with an RSI of 61.1 and the MACD in BULL territory, reinforcing the positive outlook from a momentum perspective. Performance shows a 1-month return of 4.77% and a 3-month return of 26.29%, indicating a solid longer-term trend.
The Risk/Reward ratio for CRBG stands at 0.4. This low ratio suggests that the potential return for taking on the associated risk is not particularly high, according to the OpportunityRadar's assessment. This factor warrants a closer look for investors who prioritize a more favorable balance of potential reward to risk in their investment decisions.
#7: ICUI — ICU Medical, Inc.
ICU Medical, Inc. (ICUI) shows an OpportunityRadar Score of 64, with a technical score of 70 and a fundamental score of 56. The scanner's signal is a BUY with 100% confidence, marking it as a 'STRONG ENTRY' opportunity. The current price is $178.46. Technicals are robust, featuring an RSI of 64.7 and a MACD in BULL status, pointing to strong upward momentum. The stock has delivered strong returns, with a 1-month gain of 12.98% and an impressive 3-month surge of 46.23%, highlighting significant recent appreciation.
While ICUI exhibits strong momentum, its RSI of 64.7 is approaching the 70 threshold, which traditionally indicates an overbought condition. This suggests that while the trend is strong, the stock might be due for a consolidation or minor pullback. Additionally, the Risk/Reward ratio of 0.8 is below 1.0, implying a slightly less favorable risk-adjusted outlook where potential reward is less than potential risk.
#8: BOX — Box, Inc.
Box, Inc. (BOX) is flagged with an OpportunityRadar Score of 64, comprising a technical score of 69 and a fundamental score of 56. The scanner indicates a BUY signal with 100% confidence and a 'STRONG ENTRY' recommendation. The stock is priced at $32.46. Technical indicators are positive, with an RSI of 61.0 and the MACD in BULL territory, suggesting continued upward price movement. The stock has seen a 1-month return of 6.53% and a notable 3-month return of 36.85%, demonstrating healthy growth over both periods.
Box, Inc. has a Risk/Reward ratio of 0.4. This low value suggests that for every unit of risk taken, the potential reward is less than one unit, based on the scanner's calculations. This may be a consideration for investors prioritizing higher risk-adjusted returns and seeking opportunities where potential upside significantly exceeds potential downside.
#9: WKC — World Kinect Corporation
World Kinect Corporation (WKC) has an OpportunityRadar Score of 64, with a technical score of 71 and a fundamental score of 53. The scanner provides a BUY signal with a confidence rating of 83%, leading to a 'STRONG ENTRY' recommendation, despite not being at the 100% confidence level. The price is $37.06. Technical analysis shows an RSI of 52.2. However, the MACD is in BEAR territory, presenting a divergence from the overall BUY signal. The stock's 1-month return is a modest 0.45%, although its 3-month return is a stronger 35.37%.
A primary concern for WKC is the MACD BEAR signal, which directly contradicts the BUY signal from the OpportunityRadar. This technical divergence, combined with a relatively low 1-month return of 0.45% and a confidence rating below 100% (at 83%), suggests potential short-term headwinds or a less robust overall signal, despite a Risk/Reward ratio of 1.7.
#10: CAH — Cardinal Health, Inc.
Cardinal Health, Inc. (CAH) rounds out the top ten with an OpportunityRadar Score of 64, featuring a technical score of 68 and a fundamental score of 58. The scanner issues a BUY signal with 100% confidence, indicating a 'STRONG ENTRY' at its current price of $237.07. Technical indicators include an RSI of 57.0 and a MACD in BULL territory, supporting a positive price trend. The stock's recent performance includes a 1-month return of 5.39% and a 3-month return of 27.22%, reflecting consistent upward movement.
While CAH shows a 100% confidence BUY signal, its Risk/Reward ratio of 1.1, while positive, is on the lower side for a 'STRONG ENTRY' compared to opportunities with higher ratios like KELYA (2.0) or WKC (1.7). This implies a more modest potential return relative to the inherent risk, which investors may want to factor into their decision-making process.
Key Observations Across the Scan
- Out of the ten profiled tickers, eight received a 100% confidence rating for their BUY signals, indicating a high degree of conviction from the OpportunityRadar scanner. The remaining two, Kelly Services, Inc. (KELYA) and World Kinect Corporation (WKC), still registered strong confidence levels of 67% and 83%, respectively.
- The majority of these signals are supported by positive momentum indicators, with eight out of ten tickers displaying a MACD in BULL territory. KELYA and WKC were the exceptions, showing a MACD BEAR signal.
- The average Relative Strength Index (RSI) across these ten opportunities is approximately 60.2, suggesting that while momentum is generally positive, most stocks are not yet in traditionally overbought conditions (RSI > 70). Medpace Holdings, Inc. (MEDP) with an RSI of 65.3 and ICU Medical, Inc. (ICUI) with an RSI of 64.7 are exhibiting stronger momentum.
- Several tickers demonstrated robust short-term performance, with Medpace Holdings, Inc. (MEDP) leading the 1-month returns at 13.55%, followed by ICU Medical, Inc. (ICUI) at 12.98%, and ExxonMobil Holdings Corporatio (XOM) at 10.1%. For 3-month returns, Kelly Services, Inc. (KELYA) surged with 56.14%, ICU Medical, Inc. (ICUI) gained 46.23%, and Medpace Holdings, Inc. (MEDP) rose 41.81%.
Key Risk Factors
- Divergent Technical Signals: Two tickers, Kelly Services, Inc. (KELYA) and World Kinect Corporation (WKC), registered a MACD BEAR signal despite receiving overall BUY recommendations from the scanner. This divergence in a key momentum indicator, particularly for KELYA which also has a lower confidence of 67%, suggests potential underlying weakness that warrants careful consideration.
- Low Risk/Reward Ratios: A significant number of the profiled stocks exhibit low Risk/Reward ratios. Teledyne Technologies Incorpor (TDY) stands out with a very low 0.2, followed by Amcor plc (AMCR) at 0.3, Corebridge Financial Inc. (CRBG) at 0.4, and Box, Inc. (BOX) also at 0.4. ExxonMobil Holdings Corporatio (XOM) is at 0.6. These low ratios imply that the potential upside, based on the scanner's calculated parameters, is proportionally smaller than the potential downside, which may impact their attractiveness for certain investment strategies.
- Approaching Overbought RSI Levels: While generally healthy, Medpace Holdings, Inc. (MEDP) with an RSI of 65.3 and ICU Medical, Inc. (ICUI) with an RSI of 64.7 are nearing the 70 threshold. An RSI above 70 typically suggests a stock may be overbought and could be due for a price correction or consolidation, indicating that potential entry points might be less optimal for new positions without further confirmation.
About Our Methodology
OpportunityRadar scans 6,600+ US stocks daily using 15+ technical indicators including RSI, MACD, Bollinger Bands, ADX, Aroon, support/resistance levels, and volume analysis, combined with fundamental metrics. Stocks are scored 0-100 with signals ranging from Accumulate to Strong Buy. Entry confidence is rated 50-100% based on 6 confirmation factors.
Disclaimer: This article is for informational purposes only and does not constitute financial advice. Past performance does not guarantee future results. Always conduct your own research and consult a qualified financial advisor before making investment decisions. Data as of August 12, 2026.
Related Articles

Disclaimer : The above information is for general informational purposes only. All information on the Site is provided in good faith, however we make no representation or warranty of any kind, express or implied, regarding the accuracy, adequacy, validity, reliability, availability or completeness of any information on the Site.