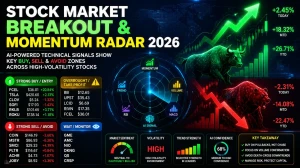
Stock Market Breakout & Momentum Radar 2026: AI-Powered Technical Signals Show Key Buy, Sell & Avoid Zones Across High-Volatility Stocks
AI-driven technical analysis of major momentum stocks reveals breakout candidates, overbought profit zones, and strong downtrend warnings. Discover actionable buy, hold, and avoid signals based on RSI, MACD, volume, and trend strength indicators.
by Kowsalya
Published Jul 01, 2026 | Updated Jul 01, 2026 | 📖 4 min read
Article continues below advertisement

Market Overview (AI Technical Summary)
The latest multi-indicator scan across high-volume US equities shows a highly rotational market where:
- Momentum stocks are still active, but risk-reward is weakening in many breakouts
- Several names are overbought (RSI > 70), signaling profit-taking zones
- A large group remains in strong downtrends with “avoid” signals
- Select stocks still show high-conviction breakout setups with volume confirmation
Overall market structure:
“Selective bullish momentum with rising caution on extended rallies.”
Featured Snippet: Top AI Signal Summary
Q: Which stocks show the strongest buy signals right now?
Top Strong Buy / Entry Candidates
- FCEL – strong momentum continuation, high volatility breakout
- TSLA – volume-supported breakout, but extended
- CLOV – breakout structure with strong trend confirmation
- SOFI – breakout setup, moderate confirmation
- RKLB – trend continuation, institutional interest visible
- ROKU – strong continuation trend, improving structure
Best Momentum Stocks (High Conviction Signals)
1. Breakout & Trend Continuation Leaders
These stocks show strong trend strength + volume confirmation:
- FCEL → explosive momentum breakout
- TSLA → continuation trend, institutional participation
- ROKU → stable uptrend with consistent buying pressure
- CLOV → breakout + strong OBV support
- SOFI → accumulation breakout zone forming
Key Insight:
Most strong setups are already extended, meaning timing entry pullbacks is critical.
2. High Risk–High Reward Small Caps
These names show volatility-driven setups:
- RKLB → strong aerospace momentum cycle
- ASTS → consolidation breakout potential
- DNA → trend continuation with strong volume spikes
- ARKK → ETF momentum rotation signal
AI Note:
These are not low-risk trades—they rely heavily on sentiment and sector momentum.
Overbought Stocks (Profit-Taking Zone)
Stocks showing RSI > 70 with stretched momentum:
- BB (overheated rally phase)
- FCEL (very extended move)
- TSLA (short-term overbought signals)
- UPST (breakout but stretched)
- LCID (extended breakout zone)
- RIVN (momentum peak risk)
Snippet Insight
When RSI stays above 70 + price is far from SMA50 →
probability increases for pullback or consolidation
Strong Sell / Downtrend Warning List
These stocks show weak structure, falling OBV, and bearish MACD:
- COIN → heavy sell pressure, breakdown trend
- MSTR → strong downtrend continuation
- SMCI → sharp reversal weakness
- AI → weak structure, no momentum recovery
- PLTR → persistent downtrend pressure
- ACHR / JOBY → aviation weakness trend
- MSTR / CORZ / CLSK → crypto-linked weakness cycle
Key Insight:
Most weak stocks share one pattern:
“Death cross + falling OBV + weak RSI recovery”
Mid-Zone (Wait / Monitor Stocks)
These are not strong buys or sells yet:
- GME → ranging, neutral momentum
- AMC → oversold bounce potential but weak trend
- NIO / PLUG → sideways structure
- DKNG → range-bound consolidation
- QS → accumulation phase possible
- CRSP → early breakout signals but not confirmed
AI Market Insight (Important Takeaway)
1. Breakouts are becoming less efficient
Many stocks are showing:
- Breakouts without strong follow-through
- Weak risk-to-reward (<1.3:1 in many cases)
2. Downtrend dominance in speculative names
EV, biotech, and small-cap tech remain under pressure.
3. Energy & crypto-linked volatility persists
MSTR, COIN, RIOT, MARA show sharp swings but weak structure.
4. Selective AI + growth rotation continues
ROKU, SOFI, RKLB show relative strength vs broader weakness.
Quick Action Table (Simplified)
| Category | Stocks |
|---|---|
| Strong Buy / Entry | FCEL, TSLA, CLOV, SOFI, RKLB, ROKU |
| Overbought / Take Profit | BB, UPST, LCID, RIVN, FCEL |
| Strong Sell / Avoid | COIN, MSTR, SMCI, PLTR, ACHR, JOBY |
| Wait / Monitor | GME, AMC, NIO, DKNG, QS, CRSP |
Featured Snippet: Key Trading Rule
Q: What is the safest approach in this market?
The safest strategy is:
- Buy only on pullbacks in strong uptrends
- Avoid chasing overbought breakouts
- Stay away from death-cross downtrends
- Prefer stocks with volume confirmation + rising OBV
The current market is not broadly bullish—it is selectively bullish with strong rotation behavior. Winners are concentrated in momentum leaders, while most speculative names remain under structural pressure.
Traders should focus on:
- Trend strength over hype
- Risk-reward clarity
- Volume confirmation before entry
Disclaimer: This article is for informational and educational purposes only. It does not constitute financial advice, investment recommendations, or trading guidance. Stock markets are volatile, and all investments carry risk of loss. Always conduct your own research or consult a licensed financial advisor before making investment decisions.
Related Articles
Disclaimer : The above information is for general informational purposes only. All information on the Site is provided in good faith, however we make no representation or warranty of any kind, express or implied, regarding the accuracy, adequacy, validity, reliability, availability or completeness of any information on the Site.