Cybersecurity Stocks to Buy Now: Technical Data Signals Massive Sector Breakout
Full technical data breakdown for cybersecurity and software stocks like CRWD, PANW, FTNT, and BB. Discover which tickers are flashing strong buy signals and which ones to avoid.
by Kowsalya
Published Jul 01, 2026 | Updated Jul 01, 2026 | 📖 4 min read
Article continues below advertisement

Cybersecurity and Tech Stocks Flashing Major Buy Signals: Market Data & Trend Analysis
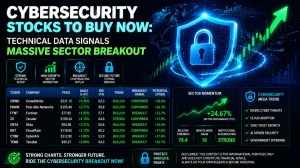
The cybersecurity and enterprise software sectors are experiencing a massive influx of institutional capital, driving key industry players into strong technical breakout zones. A comprehensive data breakdown reveals that while several market leaders have broken into highly profitable macro trends, a distinct group of overextended tickers is signaling that a short-term pullback is necessary before deploying new capital.
The technical evidence shows that Palo Alto Networks (PANW), CrowdStrike (CRWD), and BlackBerry (BB) are leading the sector's momentum profile with textbook "Golden Cross" configurations and soaring On-Balance Volume (OBV). Meanwhile, legacy providers face structural downtrends that traders should actively avoid.
Sector Leaders Flashing "Strong Buy" Signals
Aggressive software accumulation is heavily concentrated in cloud security, endpoint protection, and identity management. The table below outlines the core metrics for the most actionable setups in the space right now.
Cybersecurity & Software Tickers at a Glance
| Ticker | Price | RSI | Trend | Entry Zone | Target 1 | Action / Strategy |
| CRWD | $763.14 | 70.3 | TRENDING | $622.73 – $694.39 | $830.59 | TAKE PROFIT (RSI Overbought) |
| PANW | $341.02 | 79.4 | TRENDING | Extended | $367.61 | WAIT (Wait for pullback) |
| FTNT | $153.62 | 67.6 | TRENDING | $138.28 – $146.79 | $165.20 | TIGHTEN STOP (Protect profits) |
| ZS | $141.15 | 55.2 | RANGING | $118.19 – $129.96 | $157.84 | HOLD (Poor risk/reward ratio) |
| BB | $12.65 | 79.4 | TRENDING | Extended | $14.40 | TAKE PROFIT (RSI Overbought) |
Technical Insight: Palo Alto Networks (PANW) and BlackBerry (BB) are exhibiting pure momentum profiles, with both stocks trading completely above their historical upper Bollinger Bands. Because their Relative Strength Index (RSI) metrics have climbed deeply into overbought territory (79.4), immediate chasing carries a high risk of localized capital drawdown.
Analyzing the Breakout Mechanics
The underlying health of this sector rally is confirmed by a few critical technical parameters that automated trading algorithms are actively exploiting:
- High-Conviction Volume Profile: Tickers like Datadog (DDOG) at $260.36 and Okta (OKTA) at $136.45 are printing rising On-Balance Volume (OBV) structures. This proves that the price appreciation is backed by true institutional accumulation rather than thin-volume retail speculation.
- The Golden Cross Advantage: A significant portion of the top-ranked equities are utilizing a 50-day Simple Moving Average (SMA50) that is tracking cleanly above the 200-day Simple Moving Average (SMA200). This long-term directional tailwind is highly visible in stocks like Fortinet (FTNT) and JFrog (FROG).
- Massive Momentum Surges: Secondary plays like Qualys (QLYS) and Tenable (TENB) are demonstrating extreme technical strength, with quarterly returns climbing well past 50% to 100%, fueled by an Average Directional Index (ADX) greater than 30, which confirms a fiercely strong trend.
The Avoid List: Structural Downtrends to Evade
While green data blocks dominate the software space, certain legacy tech names and defense IT integrators are flashing severe structural decay. Bottom-fishing in these names exposes portfolios to major downside risks.
- Oracle (ORCL): Trading at $146.55, ORCL has entered a major distribution phase. It carries a severe "Strong Sell" rating with a score of -14, a collapsing money flow index (MFI), and price action pinned far below its SMA50 ($187.89).
- Leidos Holdings (LDOS): At $102.97, LDOS is locked into a vicious daily downtrend. An exceptionally high ADX of 49.3 proves that the sellers are firmly in control of the tape, making the stock an immediate "Exit Now" candidate.
- Booz Allen Hamilton (BAH): Trading at $60.67, Booz Allen has cratered nearly 42% off its recent highs. Its RSI is deep in oversold territory at 26.9, but without a confirmed MACD bullish histogram flip, it remains a dangerous falling knife.
Strategic Playbook for Active Traders
- Protect Extravagant Gains: For high-fliers like CyberArk (CYBR) or Varonis Systems (VRNS) where the price action is deeply extended, utilize a trailing stop or move your invalidation stop up to the breakeven point immediately.
- Respect Inefficient Risk-to-Reward Ratios: Do not chase breakouts where the mathematical Risk-to-Reward (R:R) ratio is lower than 1.3:1. Names like Zscaler (ZS) and HubSpot (HUBS) have valid breakout charts but unfavorable entry pricing. Wait for a backtest of key horizontal support levels before entry.
- Monitor Early MACD Reversals: Tickers like Tyler Technologies (TYL) and MicroStrategy (MDB) are showing early signs of a bullish MACD histogram shift within structural ranges, hinting at where the next wave of capital may rotate.
Disclaimer: Marketshost.com is a financial news publisher, not a registered investment advisor or broker-dealer. The technical indicators, data points, and market analysis provided in this article are solely for educational and informational purposes. Trading equities, options, and volatile technology stocks involves a high degree of financial risk. Always perform your own independent research and consult a licensed financial professional before making any investment decisions.
Related Articles

Disclaimer : The above information is for general informational purposes only. All information on the Site is provided in good faith, however we make no representation or warranty of any kind, express or implied, regarding the accuracy, adequacy, validity, reliability, availability or completeness of any information on the Site.