10 Strong Entry Buy Signals with Bull MACD — June 2026
Explore 10 stocks showing Strong Entry Buy signals with 90% at 100% confidence and Bull MACD, led by USB's 66 OpportunityRadar Score in June 2026.
by Kowsalya
Published Jun 30, 2026 | Updated Jun 30, 2026 | 📖 10 min read
Article continues below advertisement

OpportunityRadar Identifies 10 Strong Buy Signals for June 2026
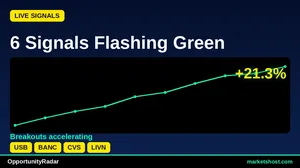
As June 2026 draws to a close, the OpportunityRadar scanner has highlighted a compelling list of 10 stocks exhibiting robust 'BUY' signals, all categorized as 'STRONG ENTRY'. Leading this selection is U.S. Bancorp (USB), which registered the highest OpportunityRadar Score of 66, driven by a strong technical score of 71. USB, priced at $60.65, also boasts a 100% confidence rating, supported by a MACD BULL signal and an RSI of 65.0, following a 1-month return of 13.27%.
The scan results reveal a consistent pattern of strength across these top-tier signals. Out of the 10 profiled tickers, nine received a perfect 100% confidence rating for their 'STRONG ENTRY' signals. All 10 tickers displayed a MACD BULL signal, indicating broad positive momentum. The Relative Strength Index (RSI) across this group generally resides in healthy territory, ranging from PCAR's 56.5 to CVS's 67.6, suggesting upward price movement without being excessively overbought at the current juncture.
Top 10 Signals at a Glance
| # | Ticker | Company | Price | Score | Confidence | RSI | MACD | 1-Month Return |
|---|---|---|---|---|---|---|---|---|
| 1 | USB | U.S. Bancorp | $60.65 | 66 | 100% | 65.0 | BULL | 13.27% |
| 2 | BANC | Banc of California, Inc. | $20.45 | 65 | 100% | 59.8 | BULL | 8.66% |
| 3 | CVS | CVS Health Corporation | $103.43 | 65 | 100% | 67.6 | BULL | 14.14% |
| 4 | LIVN | LivaNova PLC | $81.50 | 64 | 100% | 64.9 | BULL | 10.41% |
| 5 | HUBB | Hubbell Inc | $520.63 | 64 | 100% | 56.8 | BULL | 12.46% |
| 6 | PH | Parker-Hannifin Corporation | $970.18 | 63 | 100% | 63.2 | BULL | 17.84% |
| 7 | PCAR | PACCAR Inc. | $120.98 | 63 | 83% | 56.5 | BULL | 10.51% |
| 8 | MIDD | The Middleby Corporation | $171.71 | 63 | 100% | 63.8 | BULL | 9.75% |
| 9 | AIT | Applied Industrial Technologie | $337.37 | 63 | 100% | 61.9 | BULL | 12.09% |
| 10 | CPT | Camden Property Trust | $114.96 | 63 | 100% | 62.0 | BULL | 8.38% |
#1: USB — U.S. Bancorp
U.S. Bancorp (USB) stands out with the highest OpportunityRadar Score of 66 among the top signals for June 2026. This score is underpinned by an impressive technical score of 71, complemented by a fundamental score of 58. The scanner issued a 'BUY' signal with a robust 100% confidence rating and a 'STRONG ENTRY' recommendation. Currently priced at $60.65, USB's technical posture is reinforced by an RSI of 65.0 and a MACD BULL signal, indicating positive price momentum. The stock has demonstrated strong recent performance, with a 1-month return of 13.27% and a 3-month return of 16.62%.
Despite the strong technical alignment and high confidence, the Risk/Reward ratio for USB is noted at 0.2. This relatively low figure suggests that the potential reward for the identified entry might be limited compared to the associated risk, based on the scanner's internal calculations. Investors may consider this ratio when assessing the overall attractiveness of the signal.
#2: BANC — Banc of California, Inc.
Banc of California, Inc. (BANC) presents another 'STRONG ENTRY' opportunity, with an OpportunityRadar Score of 65, closely trailing USB. Its technical score matches USB's at 71, while its fundamental score is 56. The stock, trading at $20.45, received a 'BUY' signal with a 100% confidence rating. Technical indicators for BANC align positively, featuring an RSI of 59.8 and a MACD BULL signal, suggesting that the stock is experiencing upward price momentum without being overextended. BANC has delivered an 8.66% return over the past month and a 16.33% return over the last three months.
A point for consideration with BANC is its Risk/Reward ratio of 0.3. Similar to USB, this ratio indicates that the potential for upside might be constrained relative to the downside risk identified by the scanner. While the technical setup appears favorable, the risk/reward metric warrants careful evaluation for those prioritizing higher potential returns relative to risk.
#3: CVS — CVS Health Corporation
CVS Health Corporation (CVS) is featured with an OpportunityRadar Score of 65, stemming from a technical score of 69 and a fundamental score of 58. The scanner has identified a 'BUY' signal with 100% confidence and a 'STRONG ENTRY' recommendation for CVS, currently priced at $103.43. The technical picture for CVS is characterized by an RSI of 67.6 and a MACD BULL signal, which collectively point to robust upward momentum. Notably, CVS has demonstrated exceptional performance over the past three months, soaring by 44.01%, in addition to a solid 1-month return of 14.14%.
While the momentum and confidence are high, the RSI of 67.6 is approaching the 70 threshold, which is often considered an overbought level. This could suggest that the stock might be due for a period of consolidation or a minor pullback in the near term. Additionally, the Risk/Reward ratio of 0.3, while similar to some peers, indicates a relatively lower potential return compared to risk, which investors may factor into their decision-making.
#4: LIVN — LivaNova PLC
LivaNova PLC (LIVN) appears on the list with an OpportunityRadar Score of 64, comprising a technical score of 69 and a fundamental score of 56. The scanner has issued a 'BUY' signal with a 100% confidence rating and a 'STRONG ENTRY' at its current price of $81.50. LIVN's technical indicators support this positive outlook, with an RSI of 64.9 and a MACD BULL signal, both suggesting a sustained upward trend. The stock has shown strong recent price appreciation, posting a 1-month return of 10.41% and a significant 3-month return of 28.22%.
The Risk/Reward ratio for LIVN is 0.3, a figure that suggests the potential return might not significantly outweigh the inherent risk identified by the OpportunityRadar system. While the technical momentum and high confidence are compelling, a lower risk/reward ratio prompts consideration of whether the potential upside aligns with individual risk tolerance.
#5: HUBB — Hubbell Inc
Hubbell Inc (HUBB), priced at $520.63, registers an OpportunityRadar Score of 64, with a technical score of 68 and a fundamental score of 58. The scanner has designated HUBB with a 'BUY' signal, a 100% confidence level, and a 'STRONG ENTRY'. Its technical profile includes an RSI of 56.8 and a MACD BULL signal, indicating healthy, sustained upward movement without signs of being overextended. HUBB's recent performance includes a 1-month return of 12.46% and a 3-month return of 6.09%, demonstrating continued positive trajectory.
The Risk/Reward ratio for HUBB is 0.5. While this is higher than some of the other entries on this list, it still represents a moderate balance between potential reward and risk. Investors might consider this ratio in conjunction with the stock's substantial price point and its 3-month return, which is lower than several other high-confidence signals identified.
#6: PH — Parker-Hannifin Corporation
Parker-Hannifin Corporation (PH) is identified with an OpportunityRadar Score of 63, featuring a technical score of 67 and a fundamental score of 58. The scanner has issued a 'BUY' signal with a 100% confidence rating and a 'STRONG ENTRY' at its current price of $970.18. PH's technical strength is evident with an RSI of 63.2 and a MACD BULL signal, both pointing to a positive trend. The stock has shown considerable short-term strength, with a 1-month return of 17.84%, the highest among the top 10, and a 3-month return of 8.37%.
Despite the robust recent returns and high confidence, PH carries a Risk/Reward ratio of 0.3. This ratio indicates that the potential for further upside, as measured by the scanner, might be limited in proportion to the identified risk. For a stock trading at nearly $1000, this metric could be a significant factor for investors assessing entry points.
#7: PCAR — PACCAR Inc.
PACCAR Inc. (PCAR) holds an OpportunityRadar Score of 63, with a technical score of 66 and a fundamental score of 58. The scanner indicates a 'BUY' signal and a 'STRONG ENTRY' for PCAR, currently priced at $120.98. The technical indicators show an RSI of 56.5 and a MACD BULL signal, suggesting a positive trend. PCAR has recorded a 1-month return of 10.51% and a 3-month return of 4.74%, indicating steady, albeit more moderate, recent gains compared to some other signals.
A notable aspect of PCAR's signal is its confidence rating of 83%, which is lower than the 100% seen in most other top signals. This lower confidence suggests that while the 'BUY' signal is strong, there may be fewer confirming factors or a slight divergence in some underlying metrics compared to its peers. However, PCAR also stands out with the highest Risk/Reward ratio on this list at 1.2, implying a more favorable balance of potential upside to downside risk.
#8: MIDD — The Middleby Corporation
The Middleby Corporation (MIDD) is another 'STRONG ENTRY' signal, with an OpportunityRadar Score of 63, driven by a technical score of 67 and a fundamental score of 56. Trading at $171.71, MIDD received a 'BUY' signal with a 100% confidence rating. Its technical profile includes an RSI of 63.8 and a MACD BULL signal, indicating a clear upward price trend. MIDD has demonstrated significant performance over the longer term, with a 3-month return of 29.51%, alongside a 1-month return of 9.75%.
The Risk/Reward ratio for MIDD is 0.3, which is on the lower end of the spectrum among these strong signals. This suggests that while the technical setup is robust and confidence is high, the potential for reward relative to the identified risk is somewhat constrained. Investors might weigh this ratio against the strong multi-month performance when considering an entry.
#9: AIT — Applied Industrial Technologie
Applied Industrial Technologie (AIT) shows an OpportunityRadar Score of 63, supported by a technical score of 67 and a fundamental score of 58. The scanner has issued a 'BUY' signal with a 100% confidence rating and a 'STRONG ENTRY' at its current price of $337.37. AIT's technical indicators, including an RSI of 61.9 and a MACD BULL signal, point to positive momentum. The stock has posted strong recent gains, with a 1-month return of 12.09% and a substantial 3-month return of 27.16%.
A key factor to note for AIT is its Risk/Reward ratio of 0.2, which is tied for the lowest among the profiled tickers. This low ratio suggests that the scanner identifies a relatively limited potential for reward compared to the risk involved. Despite the strong technical scores and recent performance, investors should carefully assess this risk/reward dynamic.
#10: CPT — Camden Property Trust
Camden Property Trust (CPT) rounds out the top 10 signals, with an OpportunityRadar Score of 63, a technical score of 66, and a fundamental score of 58. The scanner has generated a 'BUY' signal with a 100% confidence rating and a 'STRONG ENTRY' for CPT, currently priced at $114.96. Technical analysis shows an RSI of 62.0 and a MACD BULL signal, both indicative of positive price action. CPT has delivered an 8.38% return over the past month and a 17.72% return over the last three months.
CPT's Risk/Reward ratio is 0.6, which is among the higher figures within this selection, suggesting a more balanced or potentially favorable risk-to-reward profile compared to many others on the list. While its 1-month return of 8.38% is not the highest, it still represents solid performance, and the RSI of 62.0 indicates room for further movement before reaching overbought conditions.
Key Observations Across the Scan
- A significant majority of the top 10 signals, specifically 9 out of 10, were issued with a 100% confidence rating, underscoring the strong alignment of underlying factors.
- All 10 profiled tickers displayed a MACD BULL signal, indicating widespread positive momentum across this selection of stocks.
- Every ticker on this list received a 'STRONG ENTRY' recommendation from the OpportunityRadar system.
- Several tickers demonstrated strong short-term performance, with Parker-Hannifin Corporation (PH) leading with a 1-month return of 17.84%, followed by CVS Health Corporation (CVS) at 14.14%.
- CVS Health Corporation (CVS) also posted the highest 3-month return among the group, with a remarkable 44.01% gain.
- The Relative Strength Index (RSI) for these tickers generally falls within a healthy range, with the lowest at PCAR's 56.5 and the highest at CVS's 67.6, suggesting upward movement without immediate signs of being excessively overbought.
Key Risk Factors
- A prevalent risk factor across many of these signals is the relatively low Risk/Reward ratio. U.S. Bancorp (USB) and Applied Industrial Technologie (AIT) both show a ratio of 0.2, indicating that the potential reward might be limited in proportion to the identified risk.
- PACCAR Inc. (PCAR) stands out with a confidence rating of 83%, which is lower than the 100% confidence observed in the other nine profiled tickers. This could imply a slightly less robust confirmation of its 'BUY' signal.
- CVS Health Corporation (CVS) exhibits an RSI of 67.6. While not yet at 70, this level is nearing the commonly accepted overbought threshold, which could signal a potential for short-term price consolidation or a pullback.
About Our Methodology
OpportunityRadar scans 6,600+ US stocks daily using 15+ technical indicators including RSI, MACD, Bollinger Bands, ADX, Aroon, support/resistance levels, and volume analysis, combined with fundamental metrics. Stocks are scored 0-100 with signals ranging from Accumulate to Strong Buy. Entry confidence is rated 50-100% based on 6 confirmation factors.
Disclaimer: This article is for informational purposes only and does not constitute financial advice. Past performance does not guarantee future results. Always conduct your own research and consult a qualified financial advisor before making investment decisions. Data as of June 30, 2026.
Related Articles
Disclaimer : The above information is for general informational purposes only. All information on the Site is provided in good faith, however we make no representation or warranty of any kind, express or implied, regarding the accuracy, adequacy, validity, reliability, availability or completeness of any information on the Site.