
10 Strong Buy Signals with 100% Confidence – July 2026
Explore 10 top-rated stocks for July 2026, featuring high OpportunityRadar scores up to 67, 100% confidence BUY signals, and robust technicals like MACD BULL.
by Kowsalya
Published Jul 03, 2026 | Updated Jul 03, 2026 | 📖 12 min read
Article continues below advertisement

OpportunityRadar Uncovers 10 High-Confidence Buy Signals for July 2026
As July 2026 begins, the MarketsHost.com OpportunityRadar scanner has identified a compelling set of equity signals, with Future Vision II Acquisition C (FVN) leading the pack. FVN stands out with the highest OpportunityRadar Score of 67, driven by an impressive technical score of 80 and a fundamental score of 47. Crucially, FVN also registers a STRONG BUY signal backed by a 100% confidence rating and a STRONG ENTRY recommendation, marking it as a significant highlight from today's scan. The stock, priced at $10.97, demonstrates a bullish MACD and an RSI of 64.3, indicating positive momentum.
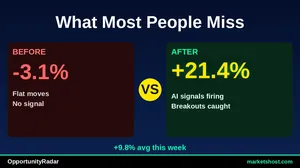
Today's scan reveals a robust landscape of potential opportunities, with all ten of the top-ranked tickers presenting a 100% confidence rating on their respective BUY or STRONG BUY signals. This high level of conviction across multiple assets underscores a strong alignment of underlying factors. The average RSI for these ten tickers calculates to approximately 59.67, suggesting generally healthy momentum without being universally overbought. Furthermore, a consistent theme is the MACD indicator, which is in BULL territory for every one of these initial ten selections, signaling a broad positive trend.
Top 10 Signals at a Glance
The table below summarizes the key metrics for the top 10 tickers identified by the OpportunityRadar scan as of July 03, 2026.
| # | Ticker | Company | Price | Score | Confidence | RSI | MACD | 1-Month Return |
|---|---|---|---|---|---|---|---|---|
| 1 | FVN | Future Vision II Acquisition C | $10.97 | 67 | 100% | 64.3 | BULL | 1.11% |
| 2 | FBP | First BanCorp. New | $26.33 | 65 | 100% | 63.6 | BULL | 11.28% |
| 3 | ACMR | ACM Research, Inc. | $97.77 | 65 | 100% | 51.3 | BULL | 10.03% |
| 4 | FNB | F.N.B. Corporation | $19.03 | 65 | 100% | 60.9 | BULL | 11.48% |
| 5 | AMAT | Applied Materials, Inc. | $603.04 | 65 | 100% | 54.0 | BULL | 20.42% |
| 6 | CR | Crane Company | $217.64 | 65 | 100% | 65.0 | BULL | 16.95% |
| 7 | BNED | Barnes & Noble Education, Inc | $12.19 | 64 | 100% | 55.4 | BULL | 18.58% |
| 8 | BCRX | BioCryst Pharmaceuticals, Inc. | $9.84 | 64 | 100% | 60.3 | BULL | 19.27% |
| 9 | SXI | Standex International Corporat | $327.87 | 64 | 100% | 57.9 | BULL | 12.13% |
| 10 | RF | Regions Financial Corporation | $30.28 | 64 | 100% | 64.0 | BULL | 10.51% |
#1: FVN — Future Vision II Acquisition C
Future Vision II Acquisition C (FVN) registers the highest OpportunityRadar Score in today's scan at 67, underpinned by an exceptional technical score of 80 and a fundamental score of 47. The scanner issues a STRONG BUY signal with 100% confidence and a STRONG ENTRY recommendation. Priced at $10.97, FVN displays a bullish MACD and an RSI of 64.3. Its short-term performance shows a 1-month return of 1.11% and a 3-month return of 2.33%. The Risk/Reward ratio for FVN is noted at 1.9, indicating a favorable potential return relative to risk.
A notable aspect of FVN's data is the absence of specific values for several key metrics, including P/E, EPS, Debt/Equity, earnings growth, revenue growth, and specific price targets or support/resistance levels. While the high technical score and strong signal confidence are compelling, the lack of detailed fundamental data or defined technical levels like stop-loss or targets means investors rely heavily on the overarching OpportunityRadar score and current momentum indicators, which show N/A for Trend, Momentum, Volume, and Risk breakdowns.
#2: FBP — First BanCorp. New
First BanCorp. New (FBP) is highlighted with an OpportunityRadar Score of 65, comprising a technical score of 71 and a fundamental score of 56. The scanner points to a BUY signal with 100% confidence and a STRONG ENTRY. Trading at $26.33, FBP's technical posture includes a bullish MACD and an RSI of 63.6. The stock has demonstrated strong recent performance, with a 1-month return of 11.28% and an impressive 3-month return of 21.11%, signaling significant upward momentum in the recent past.
Despite the strong BUY signal and robust recent returns, FBP presents a low Risk/Reward ratio of 0.2. This numerical value suggests that the potential reward might be limited relative to the inherent risk, which could be a point of consideration for investors. Similar to FVN, the scanner data for FBP does not provide specific fundamental metrics such as P/E, EPS, or growth rates, nor does it define price targets, support, or resistance levels, leaving broader context to the overall score and the immediate technical indicators.
#3: ACMR — ACM Research, Inc.
ACM Research, Inc. (ACMR) garners an OpportunityRadar Score of 65, with its technical score at 73 and fundamental score at 53. The stock is marked with a BUY signal, 100% confidence, and a STRONG ENTRY. Priced at $97.77, ACMR's technical analysis shows an RSI of 51.3, which is in a neutral zone, coupled with a bullish MACD indicator. The stock has experienced substantial growth, posting a 1-month return of 10.03% and a remarkable 3-month return of 141.17%, indicating a powerful upward trajectory over the past quarter.
While ACMR's 3-month return of 141.17% is exceptionally strong, such rapid appreciation can sometimes lead to increased volatility or a period of consolidation. The Risk/Reward ratio stands at 2.0, which is a favorable indicator. However, similar to other profiled stocks, the scanner data does not provide specific fundamental metrics like P/E or EPS, nor does it outline specific price targets or stop levels, which means the analysis is primarily anchored to the strong technical momentum and the OpportunityRadar score.
#4: FNB — F.N.B. Corporation
F.N.B. Corporation (FNB) registers an OpportunityRadar Score of 65, with its technical score at 71 and fundamental score at 56. The stock is characterized by a BUY signal with 100% confidence and a STRONG ENTRY recommendation. Trading at $19.03, FNB's technical indicators include an RSI of 60.9, suggesting healthy upward momentum without being overbought, and a bullish MACD. The stock has posted solid recent returns, with a 1-month gain of 11.48% and a 3-month gain of 12.87%, indicating consistent positive performance.
A key data point to observe for FNB is its Risk/Reward ratio of 0.3. This low ratio suggests that the potential upside may be limited relative to the downside risk, despite the strong BUY signal and 100% confidence. As with other entries on this scan, there is an absence of specific fundamental data such as P/E or EPS, and no defined targets or support/resistance levels are provided in the scanner data, directing focus to the overall score and immediate technical trends.
#5: AMAT — Applied Materials, Inc.
Applied Materials, Inc. (AMAT) is featured with an OpportunityRadar Score of 65, supported by a technical score of 71 and a fundamental score of 55. The scanner indicates a BUY signal with 100% confidence and a STRONG ENTRY. Priced at $603.04, AMAT's technical profile includes an RSI of 54.0, positioning it firmly in neutral-to-bullish territory, and a MACD indicator that is also bullish. The stock has demonstrated impressive returns, with a 1-month gain of 20.42% and a substantial 3-month gain of 73.05%, reflecting strong recent performance.
AMAT's strong recent performance, particularly the 73.05% gain over three months, indicates significant investor interest and upward price action. While the Risk/Reward ratio is favorable at 2.0, such considerable gains can sometimes precede periods of consolidation or increased volatility. The scanner data does not provide specific fundamental metrics like P/E or EPS, nor does it offer explicit price targets or stop levels, meaning the assessment relies heavily on the robust technical scores and momentum indicators provided.
#6: CR — Crane Company
Crane Company (CR) shows an OpportunityRadar Score of 65, with a technical score of 69 and a fundamental score of 58. The stock has earned a BUY signal with 100% confidence and a STRONG ENTRY recommendation. Trading at $217.64, CR's technical indicators include an RSI of 65.0, indicating strong momentum, and a bullish MACD. The company has delivered solid returns, with a 1-month gain of 16.95% and a 3-month gain of 29.55%, showcasing consistent positive performance over the short and medium term.
Despite the strong technicals and high confidence, CR's Risk/Reward ratio is 0.4, which is on the lower side. This ratio suggests that the potential reward may not be significantly greater than the risk involved. The absence of specific fundamental data points such as P/E or EPS, and the lack of explicit price targets or support/resistance levels, means that the evaluation of CR is primarily based on its strong technical momentum and the overall OpportunityRadar score, alongside its recent price performance.
#7: BNED — Barnes & Noble Education, Inc
Barnes & Noble Education, Inc. (BNED) registers an OpportunityRadar Score of 64, with its technical score at 71 and fundamental score at 53. The scanner assigns a BUY signal with 100% confidence and a STRONG ENTRY. Priced at $12.19, BNED's technical analysis includes an RSI of 55.4, indicating healthy momentum, and a bullish MACD. The stock has demonstrated notable recent gains, with a 1-month return of 18.58% and a 3-month return of 35.44%, reflecting strong upward movement over the past quarter.
BNED's Risk/Reward ratio is 2.0, which indicates a favorable balance of potential upside relative to downside risk. While recent returns are strong, the absence of specific fundamental data points such as P/E, EPS, debt/equity, or growth rates in the scanner data means that the BUY signal and confidence rating are predominantly driven by technical factors. The lack of defined price targets or stop levels also places a greater emphasis on the immediate technical indicators and the overall OpportunityRadar score for decision-making.
#8: BCRX — BioCryst Pharmaceuticals, Inc.
BioCryst Pharmaceuticals, Inc. (BCRX) is identified with an OpportunityRadar Score of 64, featuring a technical score of 69 and a fundamental score of 56. The stock carries a BUY signal with 100% confidence and a STRONG ENTRY recommendation. Trading at $9.84, BCRX's technical profile includes an RSI of 60.3, suggesting positive momentum, and a bullish MACD. The company has seen a strong 1-month return of 19.27%, though its 3-month return is a more modest 9.09%, indicating a recent acceleration in price action.
The divergence between BCRX's robust 1-month return of 19.27% and its comparatively lower 3-month return of 9.09% suggests that recent gains have been concentrated, which could indicate a short-term spike rather than a sustained longer-term trend. The Risk/Reward ratio stands at 1.1, which is neutral. As with other entries, the scanner data does not provide specific fundamental metrics or defined price targets, support, or resistance levels, focusing the analysis on the technical indicators and the OpportunityRadar score.
#9: SXI — Standex International Corporat
Standex International Corporation (SXI) registers an OpportunityRadar Score of 64, with its technical score at 69 and fundamental score at 56. The scanner indicates a BUY signal with 100% confidence and a STRONG ENTRY. Priced at $327.87, SXI's technical indicators include an RSI of 57.9, suggesting healthy momentum, and a bullish MACD. The stock has demonstrated consistent upward movement, with a 1-month return of 12.13% and a 3-month return of 27.23%, reflecting steady positive performance over the past few months.
SXI's Risk/Reward ratio is 1.1, indicating a balanced outlook between potential gains and risks. While the technical indicators and recent returns are positive, the absence of specific fundamental data points suchs as P/E, EPS, or growth rates in the scanner data means that the BUY signal and confidence rating are primarily derived from technical analysis. The lack of explicit price targets or stop levels further emphasizes the reliance on the overall OpportunityRadar score and immediate technical trends for investment assessment.
#10: RF — Regions Financial Corporation
Regions Financial Corporation (RF) completes our top 10 list with an OpportunityRadar Score of 64, driven by a technical score of 68 and a fundamental score of 58. The stock has received a BUY signal with 100% confidence and a STRONG ENTRY. Trading at $30.28, RF's technical profile includes an RSI of 64.0, indicating robust momentum, and a bullish MACD. The company has shown positive recent performance, with a 1-month return of 10.51% and a 3-month return of 14.39%, demonstrating consistent gains.
A key point of consideration for RF is its Risk/Reward ratio of 0.3, which is relatively low. This suggests that the potential reward may be limited compared to the risk involved, despite the strong BUY signal and high confidence level. As with other stocks in this scan, the data does not include specific fundamental metrics like P/E or EPS, nor does it provide explicit price targets or support/resistance levels. Therefore, the assessment is predominantly based on the strong technical indicators and the overall OpportunityRadar score.
Key Observations Across the Scan
Analyzing the initial ten tickers identified by the OpportunityRadar scanner reveals several consistent themes as of July 03, 2026. All ten profiled stocks — FVN, FBP, ACMR, FNB, AMAT, CR, BNED, BCRX, SXI, and RF — received a 100% confidence rating for their BUY or STRONG BUY signals, underscoring a high level of conviction from the scanning methodology. Furthermore, every one of these ten tickers displayed a MACD in BULL territory, indicating a broad positive trend across this selection.
Momentum indicators are generally strong, with six of the ten tickers (FVN, FBP, FNB, CR, BCRX, RF) showing an RSI above 60, suggesting robust upward price movement. The average RSI for these ten stocks stands at approximately 59.67. In terms of recent performance, nine out of the ten tickers (FBP, ACMR, FNB, AMAT, CR, BNED, BCRX, SXI, RF) posted 1-month returns greater than 10%, highlighting significant short-term gains. Six tickers (FBP, ACMR, AMAT, CR, BNED, SXI) also demonstrated strong 3-month returns exceeding 20%, indicating sustained positive trends over the medium term.
Key Risk Factors
While the OpportunityRadar scan has identified a compelling list of stocks with high confidence BUY signals, several risk factors are apparent from the provided data that warrant attention:
- Low Risk/Reward Ratios: A significant number of the scanned tickers, including FBP (0.2), FNB (0.3), CR (0.4), RF (0.3), and JHX (0.3), exhibit very low Risk/Reward ratios. These figures suggest that the potential upside may be severely limited relative to the downside risk, despite the strong buy signals. This could imply that much of the expected upside is already priced in, or that the stop levels are very close to current prices, leaving little room for error.
- Elevated RSI Readings: Some tickers, such as Humana Inc. (HUM) with an RSI of 72.0 and Maravai LifeSciences Holdings (MRVI) with an RSI of 70.2, show RSI values above 70. While MACD is bullish for both, an RSI above 70 traditionally indicates an overbought condition, which can precede a price pullback or consolidation, even if the overall trend remains positive.
- Divergent Technical Signals: M-tron Industries, Inc. (MPTI) presents a notable divergence, with its MACD indicator in BEAR territory despite receiving a BUY signal with 83% confidence and a STRONG ENTRY. Furthermore, MPTI's 1-month return is a marginal 0.1%. This combination of a bearish MACD and minimal short-term gains, contrasted with a BUY signal, suggests conflicting technical forces that could introduce uncertainty.
About Our Methodology
OpportunityRadar scans 6,600+ US stocks daily using 15+ technical indicators including RSI, MACD, Bollinger Bands, ADX, Aroon, support/resistance levels, and volume analysis, combined with fundamental metrics. Stocks are scored 0-100 with signals ranging from Accumulate to Strong Buy. Entry confidence is rated 50-100% based on 6 confirmation factors.
Disclaimer: This article is for informational purposes only and does not constitute financial advice. Past performance does not guarantee future results. Always conduct your own research and consult a qualified financial advisor before making investment decisions. Data as of July 03, 2026.
Related Articles
Disclaimer : The above information is for general informational purposes only. All information on the Site is provided in good faith, however we make no representation or warranty of any kind, express or implied, regarding the accuracy, adequacy, validity, reliability, availability or completeness of any information on the Site.