
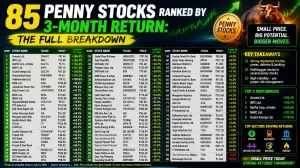
85 Penny Stocks Ranked by 3-Month Return: The Full Breakdown
From a 335% quantum-sector runner to stocks down 97% off their highs - here's how 85 small-cap and penny stocks actually performed over the past week, month, and quarter.
by Kowsalya
Published Jul 03, 2026 | Updated Jul 03, 2026 | 📖 5 min read
Article continues below advertisement

This Penny Stock Is Up 335% in 3 Months - But Most of Its Peers Are Down 60% or More
A screen of roughly 85 small-cap and penny stocks - spanning cannabis, EVs, hydrogen fuel cells, quantum computing, biotech, and uranium miners - shows a market of extremes rather than a unified trend. FCEL leads the group with a 335% three-month gain, while names like PHGE, KITT, and ORGN sit more than 90% below their 52-week highs. Same universe, wildly different outcomes.
This breakdown uses only verified price-return data (1-week, 1-month, 3-month, and distance from 52-week high) rather than the automated technical "buy/sell" labels in the raw dataset, several of which returned broken or contradictory readings. Here's what the clean numbers actually show.
The Quick Answer: Biggest Movers Right Now
Top 3-month gainers:
- FCEL: +335.1%
- CLOV: +209.4%
- ASTC: +134.8%
- GCTS: +131.8%
- MRAM: +108.0%
Steepest declines from 52-week highs:
- PHGE: -97.3%
- KITT: -96.2%
- ORGN: -95.7%
- AITX: -92.9%
- BCAB: -93.1%
The takeaway: this is a stock-picker's minefield, not a sector-wide trend. A handful of names are compounding fast gains while dozens of others in the same risk tier are sitting near multi-year lows.
Cannabis Stocks: Still Searching for a Bottom
The three most-traded cannabis names in the screen are all down over the past month, even with modest weekly bounces:
| Ticker | Price | 1W Return | 1M Return | 3M Return | Off 52-Wk High |
|---|---|---|---|---|---|
| Sundial Growers (SNDL) | $1.38 | +3.0% | -4.2% | +3.8% | -51.1% |
| Tilray (TLRY) | $4.62 | +3.6% | -14.1% | -24.8% | -78.0% |
| Aurora Cannabis (ACB) | $2.84 | +2.9% | -19.1% | -15.2% | -54.4% |
All three remain more than 50% below their 52-week highs, and the monthly trend is negative across the board despite small weekly upticks - a pattern that shows short-term dip-buying without a real trend reversal.
Clean Energy and EV Names: A Split Story
Hydrogen and clean-energy names are diverging sharply from the traditional EV names in the same risk category:
- FCEL is the standout of the entire list - up 43.1% in a single week and 335.1% over three months, though it's still 21.9% below its 52-week high.
- PLUG is up 17.3% over three months but down 35.5% over the past month - a sign of a sharp recent pullback inside a longer uptrend.
- WKHS is down across every timeframe measured, including -5.7% for the week and -81.5% from its high.
- NKLA, MULN, and GOEV could not be reliably scored in this dataset due to data errors in the source file and are excluded here rather than reported inaccurately.
Quantum Computing and Deep-Tech Small-Caps
This corner of the market shows some of the widest gaps between short-term and long-term performance:
| Ticker | 1W Return | 1M Return | 3M Return | Off 52-Wk High |
|---|---|---|---|---|
| ARQQ | -13.9% | +44.6% | +73.1% | -59.6% |
| QUBT | -0.4% | -26.1% | +36.3% | -63.2% |
| QSI | +8.1% | -25.0% | +24.0% | -64.6% |
| LAES | -4.4% | -18.3% | +20.7% | -60.4% |
These names show strong 3-month momentum but sharp recent pullbacks - several are down double digits over the past month even while still up sharply over the quarter. That combination (strong 3-month, weak 1-month) often signals a stock that ran hard earlier and has since cooled off, rather than one just starting a move.
Featured Snippet: What Does "% Off High" Actually Tell You?
The "% off high" figure measures how far a stock's current price sits below its 52-week peak. It's a simple way to gauge relative risk without needing technical indicators:
- 0% to -20% off high - the stock is trading near its recent peak; momentum is currently intact
- -20% to -50% off high - a meaningful pullback has occurred; the stock may be consolidating or reversing
- -50% to -80% off high - the stock has lost the majority of its prior value; recovery would require a very large percentage gain
- Below -80% off high - the stock is in a severe, prolonged decline; several names on this list (KITT, PHGE, ORGN, AITX) fall into this category
A stock down 90% from its high needs to gain 900% just to get back to that level - a mathematical reality worth keeping in mind before treating any "recovery" narrative as a sure thing.
Biotech and Small-Cap Pharma: Pockets of Strength
A handful of biotech names bucked the broader downward drift in this dataset:
- EDIT: +33.2% (1W), +29.4% (1M), +39.9% (3M) - one of the few names positive across all three timeframes
- NKTX: +15.8% (1W), +10.7% (1M), +47.0% (3M)
- MCRB: +13.0% (1W), +5.6% (1M), but -73.0% off its 52-week high, showing the gains are a bounce from deeply depressed levels rather than a return to prior highs
Across this basket of roughly 85 small-cap and penny stocks, the data shows extreme dispersion rather than a common trend. A small number of names - led by FCEL, CLOV, and EDIT - are posting standout multi-month gains. But the majority of the list remains 40% to nearly 100% below 52-week highs, and short-term bounces in names like the cannabis trio don't yet show up in the monthly or quarterly numbers. Several tickers in the original dataset (including MULN, FFIE, GOEV, NKLA, EXPR, SOLO, AYRO, MNTK, IOBT, SGMO, MAXN, and VERB) returned corrupted data and were excluded rather than reported with unreliable figures.
Disclaimer: This article is for informational and educational purposes only and does not constitute financial, investment, or trading advice. Small-cap and penny stocks carry substantially higher volatility and risk than larger, more established companies, including the risk of significant or total loss of principal. Historical returns, including the 1-week, 1-month, and 3-month figures referenced above, do not predict future performance. Marketshost.com and its authors are not registered financial advisors, brokers, or tax professionals. Readers should conduct their own independent research and consult a licensed financial advisor before making any investment decisions.
Related Articles

Disclaimer : The above information is for general informational purposes only. All information on the Site is provided in good faith, however we make no representation or warranty of any kind, express or implied, regarding the accuracy, adequacy, validity, reliability, availability or completeness of any information on the Site.