
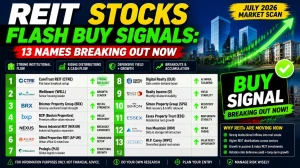
REIT Stocks Flash Buy Signals: 13 Names Breaking Out Now
Office and residential REITs are flashing rare "Strong Buy" technical signals while data-center and mortgage REITs break down. See the full screener.
by Kowsalya
Published Jul 03, 2026 | Updated Jul 03, 2026 | 📖 6 min read
Article continues below advertisement

REIT Stocks Are Splitting Into Two Camps Right Now - Here's Who's Winning and Who's Losing
Real estate investment trusts are sending one of the clearest sector-rotation signals of the year. A technical screen across roughly 90 U.S. REITs shows office, residential apartment, and self-storage names posting some of the strongest breakout scores in months - golden crosses, rising on-balance volume, and RSI readings pushing into overbought territory. At the same time, data-center landlords, mortgage REITs, and several net-lease names are stuck in confirmed downtrends, with a handful triggering outright "exit now" signals.
Here's what the data shows, broken down by sector, so you can see where the momentum actually is.
The Quick Answer: What's Hot and What's Not
- Office REITs are the surprise leaders. SL Green (SLG), Vornado (VNO), Highwoods (HIW), Cousins (CUZ), and Cadence Bank-adjacent office names are posting the highest composite technical scores in the entire screen, with 1-month returns above 13% in several cases.
- Residential apartment REITs are broadly bullish. AvalonBay (AVB), Equity Residential (EQR), Mid-America (MAA), UDR, and Essex (ESS) all carry "Strong Buy" signals with golden-cross confirmations.
- Data-center and cell-tower REITs are breaking down. American Tower (AMT), Digital Realty (DLR), and Equinix (EQIX) are all in confirmed downtrends with "Strong Sell" or "Avoid" ratings.
- Mortgage REITs are a mixed bag. Some names like PennyMac Mortgage (PMT) and Annaly (NLY) show fresh entry signals, while Two Harbors (TWO), Starwood Property (STWD), and Redwood Trust (RWT) are flashing exit warnings.
Office REITs: The Sector Nobody Expected to Lead
After years of being written off, office landlords are having a moment. The data shows several office names with composite technical scores of 13 out of a possible range - the highest reading in the entire dataset - driven by strong trend continuation setups and rising volume.
| Ticker | Price | 1M Return | 3M Return | RSI | Signal |
|---|---|---|---|---|---|
| SL Green (SLG) | $53.42 | +18.3% | +45.6% | 66.9 | Strong Buy |
| Vornado (VNO) | $40.58 | +18.6% | +58.7% | 74.2 (Overbought) | Take Profit |
| Highwoods (HIW) | $31.86 | +18.6% | +48.7% | 76.8 (Overbought) | Take Profit |
| Cousins (CUZ) | $31.06 | +13.7% | +39.4% | 75.2 (Overbought) | Take Profit |
| Cadence (CDP) | $37.67 | +18.8% | +23.2% | 78.9 (Overbought) | Take Profit |
| Boston Properties (BXP) | $69.32 | +13.3% | +35.9% | 69.4 | Tighten Stop |
The catch: most of these names have already run so far, so fast, that RSI readings above 70 are triggering "take profit" or "tighten stop" signals rather than fresh entries. The trend is real, but the easy money in this specific move looks largely made.
Residential Apartment REITs: Steadier, Less Stretched
Apartment REITs are showing a similar bullish tilt but with more room to run. Most names in this group sit in the 60–70 RSI range rather than deep overbought territory, and several still show viable entry zones rather than pure profit-taking setups.
- AvalonBay (AVB) - $193.96, +5.8% 1M, golden cross confirmed, entry zone $177.57–$186.26
- Equity Residential (EQR) - $69.83, +5.5% 1M, breakout entry with 47% confidence
- Mid-America Apartment (MAA) - $142.19, +10.3% 1M, breakout confirmed
- UDR Inc (UDR) - $41.09, RSI 70.8 (overbought), take-profit signal already active
- Camden Property (CPT) - $117.25, +10.5% 1M, breakout entry
- Essex Property (ESS) - $298.33, +7.5% 1M, breakout entry
- Invitation Homes (INVH) - $30.53, +5.8% 1M, breakout entry
Where the Screen Says "Stay Away"
Not every corner of real estate is participating in the rally. Several sub-sectors are in confirmed technical downtrends, and a few names triggered explicit exit signals.
Confirmed Downtrends (Avoid / Strong Sell)
| Ticker | Sector | Score | Signal | Note |
|---|---|---|---|---|
| American Tower (AMT) | Cell Towers | -11 | Strong Sell | Exit Now - death cross, ADX 32 |
| Redwood Trust (RWT) | Mortgage REIT | -14 | Strong Sell | Exit Now - lowest score in dataset |
| FBR Trust (FBRT) | Mortgage REIT | -8 | Strong Sell | Exit Now |
| Digital Realty (DLR) | Data Centers | -8 | Strong Sell | Below 200-day average |
| Equinix (EQIX) | Data Centers | -7 | Strong Sell | 10% below 1-month price |
| W.P. Carey (WPC) | Net Lease | -7 | Strong Sell | Downtrend confirmed |
| Two Harbors (TWO) | Mortgage REIT | -8 | Strong Sell | Below key support |
| Starwood Property (STWD) | Mortgage REIT | -6 | Strong Sell | ADX confirms trend |
The common thread: these are largely data-center/tower REITs facing rate-sensitivity concerns and commercial mortgage REITs exposed to credit-quality worries. Both groups show falling on-balance volume, a classic sign that selling pressure - not just price weakness - is driving the move.
Featured Snippet: What Makes a REIT a "Strong Buy" on This Screen?
A REIT earns a Strong Buy signal in this screener when it hits most or all of the following conditions simultaneously:
- Golden cross - the 50-day moving average is above the 200-day moving average
- Bullish MACD histogram - momentum is accelerating, not fading
- Rising on-balance volume (OBV) - buying volume is confirming the price move
- Positive DI/ADX reading - the +DI line is above -DI, showing directional strength
- Composite score of +8 or higher - combining trend, momentum, and volume factors into one number
Stocks meeting 4 of 6 or more of these conditions, with a favorable risk-to-reward ratio, are flagged as actionable entries. Stocks meeting the same conditions but with poor risk-to-reward (below roughly 1.3:1) are flagged "Hold" even if the trend is bullish - the setup is right, but the math on the trade isn't.
Mortgage REITs: A Sector Splitting Down the Middle
Unlike office and residential REITs, mortgage REITs (mREITs) show no clean sector-wide trend. Instead, individual balance-sheet quality appears to be driving results:
- PennyMac Mortgage (PMT) and Annaly Capital (NLY) show "Strong Entry" signals with 5 of 6 technical conditions met
- AG Mortgage (AOMR) and AGNC Investment (AGNC) carry Strong Buy ratings with breakout confirmation
- Two Harbors (TWO), Starwood Property (STWD), Arbor Realty (ABR), and Ready Capital (RC) remain weak or in outright downtrends
This split suggests the mortgage REIT rally, where it exists, is being driven by company-specific book value and spread trends rather than a broad sector tailwind.
Quick-Reference Table: Highest-Conviction Setups
| Ticker | Sector | Score | Confidence | Entry Zone | Risk/Reward |
|---|---|---|---|---|---|
| DOC (Healthpeak) | Healthcare | 13 | 77% | $19.00–$20.59 | 1.3:1 |
| SPG (Simon Property) | Retail/Mall | 13 | 77% | $203.49–$217.03 | 1.3:1 |
| SLG (SL Green) | Office | 13 | 77% | $47.38–$50.63 | 1.3:1 |
| VTR (Ventas) | Healthcare | 11 | 62% | Extended, wait for pullback | 1.3:1 |
| NLY (Annaly) | Mortgage | 9 | 58% | $20.98–$22.12 | 1.3:1 |
| ABR (Arbor Realty) | Mortgage | 1 | 47% | $4.98–$5.24 | 2.5:1 |
This screen paints a real estate market in the middle of a sector rotation rather than a uniform rally. Landlords tied to physical space people actually use daily - offices, apartments, self-storage, healthcare facilities - are picking up momentum. Landlords tied to digital infrastructure and mortgage credit are lagging, with several data-center and mortgage names showing confirmed technical breakdowns. For anyone tracking REITs, the sector-by-sector divergence is arguably the more important story than any single stock's move.
Disclaimer
This article is for informational and educational purposes only and does not constitute financial, investment, or trading advice. The technical indicators, scores, and price levels referenced (including RSI, MACD, moving averages, entry zones, and price targets) are derived from historical and current market data and are inherently backward-looking; they are not guarantees of future performance. All investments in stocks, including REITs, carry risk, including the potential loss of principal. Marketshost.com and its authors are not registered financial advisors, brokers, or tax professionals. Readers should conduct their own research and consult a licensed financial advisor before making any investment decisions.
Related Articles


Disclaimer : The above information is for general informational purposes only. All information on the Site is provided in good faith, however we make no representation or warranty of any kind, express or implied, regarding the accuracy, adequacy, validity, reliability, availability or completeness of any information on the Site.