10 Stocks with Strong Signals and 100% Confidence — November 2026
Explore 10 top-rated stocks for November 2026, featuring high OpportunityRadar Scores and 100% confidence BUY signals, including Costco (COST) with a score of 73.
by Kowsalya
Published Nov 19, 2026 | Updated Nov 19, 2026 | 📖 10 min read
Article continues below advertisement
Top 10 Stocks Showing Strong Buy Signals This November 2026
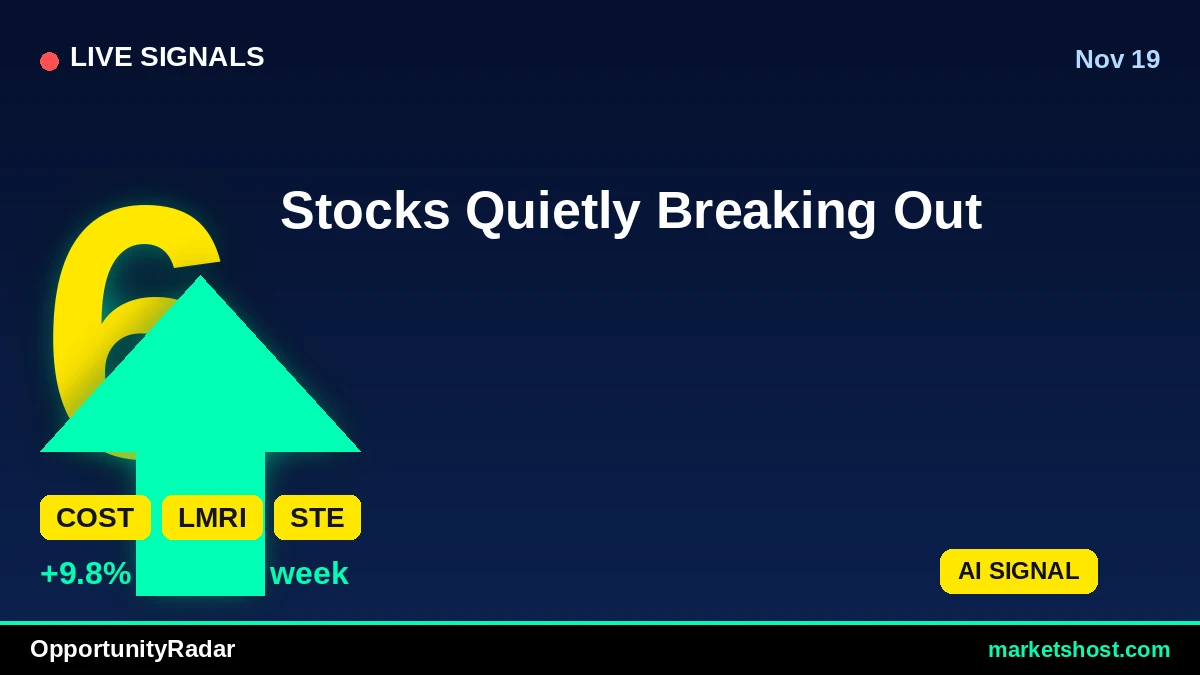
As November 2026 progresses, the latest market scan reveals a compelling set of opportunities, with several tickers registering high conviction BUY signals. Leading the pack is Costco Wholesale Corporation (COST), which stands out with an impressive OpportunityRadar Score of 73, backed by a 100% confidence rating for a STRONG ENTRY. Lumexa Imaging Holdings, Inc. (LMRI) also captures attention with a robust 27.18% return over the last month, alongside a 100% confidence BUY signal.
A closer look at today's scan data indicates a notable trend: seven of the top ten profiled tickers boast a 100% confidence rating for their BUY signals, highlighting a strong alignment of underlying factors. Across these ten, the average Relative Strength Index (RSI) registers at approximately 60.5, suggesting generally healthy momentum without being excessively overbought. Furthermore, six of these ten tickers are currently exhibiting a MACD BULL signal, reinforcing the positive technical sentiment for a majority of the selections.
Top 10 Signals at a Glance
| # | Ticker | Company | Price | Score | Confidence | RSI | MACD | 1-Month Return |
|---|---|---|---|---|---|---|---|---|
| 1 | COST | Costco Wholesale Corporation | $1085.46 | 73 | 100% | 64.3 | BULL | 6.6% |
| 2 | LMRI | Lumexa Imaging Holdings, Inc. | $13.85 | 66 | 100% | 58.9 | BULL | 27.18% |
| 3 | STE | STERIS plc | $254.18 | 65 | 100% | 60.9 | BULL | 9.45% |
| 4 | RLGT | Radiant Logistics, Inc. | $9.67 | 64 | 100% | 58.3 | BULL | 11.15% |
| 5 | AIZ | Assurant, Inc. | $314.39 | 64 | 100% | 62.7 | BULL | 8.84% |
| 6 | MSCI | MSCI Inc. | $627.79 | 64 | 67% | 50.9 | BEAR | 1.22% |
| 7 | PGNY | Progyny, Inc. | $35.13 | 63 | 100% | 65.0 | BULL | 20.64% |
| 8 | GMAB | Genmab A/S | $51.55 | 63 | 67% | 58.5 | BEAR | 28.87% |
| 9 | IRON | Disc Medicine, Inc. | $76.51 | 63 | 83% | 48.9 | BEAR | 1.98% |
| 10 | PTC | PTC Inc. | $195.92 | 63 | 50% | 71.0 | BEAR | 0.99% |
#1: COST — Costco Wholesale Corporation
Costco Wholesale Corporation (COST) leads the current scan with an OpportunityRadar Score of 73, reflecting a robust technical score of 72 and a fundamental score of 75. The scanner indicates a BUY signal with 100% confidence, marking a STRONG ENTRY. Technical indicators show an RSI of 64.3, accompanied by a MACD BULL signal, suggesting positive momentum. Over the past month, COST has delivered a 6.6% return, extending to an 11.74% gain over three months. This performance aligns with the high confidence in its current signal.
Despite the strong overall score and confidence, the Risk/Reward ratio for COST is noted at 0.4. This low ratio suggests that the potential reward may be limited relative to the inherent risk, which is a factor for consideration even with the prevailing positive technical and fundamental scores. Investors often look for higher Risk/Reward ratios to justify entry into a position.
#2: LMRI — Lumexa Imaging Holdings, Inc.
Lumexa Imaging Holdings, Inc. (LMRI) registers an OpportunityRadar Score of 66, with a strong technical score of 74, though its fundamental score is lower at 53. The stock has a BUY signal with a 100% confidence rating, indicating a STRONG ENTRY. Technical analysis shows an RSI of 58.9 and a MACD BULL signal, pointing to healthy upward momentum. LMRI has demonstrated exceptional recent performance, with a 27.18% return over the last month and a 16.88% gain over three months.
LMRI presents a favorable Risk/Reward ratio of 2.0, which suggests a potentially attractive balance between risk and upside. However, the lower fundamental score of 53, compared to its technical score of 74, could be a point of analysis for those who prioritize fundamental strength alongside technical momentum. The disparity between technical and fundamental scores is a common characteristic in some market opportunities.
#3: STE — STERIS plc
STERIS plc (STE) shows an OpportunityRadar Score of 65, comprising a technical score of 70 and a fundamental score of 58. The stock has generated a BUY signal with 100% confidence, categorized as a STRONG ENTRY. Its technical posture includes an RSI of 60.9 and a MACD BULL signal, both indicating positive price action. STE has delivered a 9.45% return in the last month and a 6.85% return over the past three months, reflecting steady growth.
The Risk/Reward ratio for STE is 0.5, which is on the lower side. This metric suggests that the potential for profit might be modest when weighed against the risk involved. While the 100% confidence and positive technicals are compelling, the lower Risk/Reward ratio is a quantitative detail that merits attention for risk-adjusted return considerations.
#4: RLGT — Radiant Logistics, Inc.
Radiant Logistics, Inc. (RLGT) registers an OpportunityRadar Score of 64, with a technical score of 71 and a fundamental score of 53. The scanner has issued a BUY signal for RLGT, backed by 100% confidence for a STRONG ENTRY. Technical indicators show an RSI of 58.3 and a MACD BULL signal, both supporting the current positive sentiment. The stock has seen a significant 11.15% return in the last month and a 14.71% return over the three-month period.
With a Risk/Reward ratio of 0.6, RLGT's potential upside relative to its risk is on the lower end of the spectrum among the profiled stocks. Additionally, similar to LMRI, RLGT's fundamental score of 53 is notably lower than its technical score of 71. This divergence suggests that while technical momentum is strong, the fundamental underpinnings, as measured by the scanner, are not as robust, which could be a point of analysis for a comprehensive investment perspective.
#5: AIZ — Assurant, Inc.
Assurant, Inc. (AIZ) holds an OpportunityRadar Score of 64, with its technical score at 68 and fundamental score at 58. The stock has a BUY signal with 100% confidence, indicating a STRONG ENTRY. Technical analysis shows an RSI of 62.7 and a MACD BULL signal, both pointing to a current bullish trend. AIZ has posted an 8.84% return over the last month and a 9.23% return over the past three months, demonstrating consistent positive performance.
The Risk/Reward ratio for AIZ is 0.4, which is among the lowest observed in this selection of tickers. This quantitative measure indicates that the potential reward for taking on the investment may be relatively small compared to the potential risk. While the high confidence and positive technicals are present, the low Risk/Reward ratio is a specific data point that could influence investment strategy, particularly for those with a strong focus on risk management.
#6: MSCI — MSCI Inc.
MSCI Inc. (MSCI) is identified with an OpportunityRadar Score of 64, split between a technical score of 68 and a fundamental score of 58. The scanner provides a BUY signal, but with a confidence rating of 67% for an ENTRY, which is lower than the 100% confidence seen in many other top signals. Technical indicators include an RSI of 50.9, which is near the neutral midpoint, and a MACD BEAR signal, indicating a bearish crossover. The stock's one-month return is 1.22%, while its three-month return is 9.88%.
The MACD BEAR signal for MSCI stands in contrast to its overall BUY signal and 67% confidence. This technical divergence, coupled with an RSI that is not strongly bullish, suggests a more cautious approach. The Risk/Reward ratio of 1.5 is more favorable than some, but the conflicting technical signals and lower confidence rating highlight a potential for increased volatility or a less clear trend direction compared to tickers with 100% confidence and MACD BULL signals.
#7: PGNY — Progyny, Inc.
Progyny, Inc. (PGNY) features an OpportunityRadar Score of 63, with a technical score of 68 and a fundamental score of 56. The stock has a BUY signal with a 100% confidence rating, signifying a STRONG ENTRY. Technical analysis shows an RSI of 65.0 and a MACD BULL signal, both indicative of strong positive momentum. PGNY has delivered impressive recent returns, with a 20.64% gain over the last month and a substantial 38.04% increase over three months.
Despite the strong performance and 100% confidence, PGNY's Risk/Reward ratio is 0.6. This lower ratio suggests that the potential for further upside may be somewhat constrained relative to the assumed risk. While the momentum is clearly positive, as evidenced by its returns and technical indicators, the Risk/Reward ratio is a quantitative measure that warrants consideration for those evaluating the balance of potential gains against risk.
#8: GMAB — Genmab A/S
Genmab A/S (GMAB) has an OpportunityRadar Score of 63, with a technical score of 67 and a fundamental score of 58. The scanner has issued a BUY signal with a confidence rating of 67% for an ENTRY. Technical indicators show an RSI of 58.5, but a MACD BEAR signal is present, indicating a bearish crossover. GMAB has shown very strong performance in recent periods, with a 28.87% return over the last month and an impressive 56.12% return over three months.
The presence of a MACD BEAR signal for GMAB, despite its BUY signal and strong recent returns, presents a technical divergence. While the stock has seen significant gains, the bearish MACD suggests a potential shift in momentum or consolidation. The 67% confidence, lower than the 100% seen in other strong entries, combined with the MACD BEAR signal, indicates that while there's a BUY signal, a degree of caution might be prudent. The Risk/Reward ratio stands at 1.6.
#9: IRON — Disc Medicine, Inc.
Disc Medicine, Inc. (IRON) holds an OpportunityRadar Score of 63, with a technical score of 70 and a fundamental score of 53. The scanner indicates a BUY signal with 83% confidence, qualifying as a STRONG ENTRY. Technical analysis shows an RSI of 48.9, placing it in neutral territory, and a MACD BEAR signal. Over the last month, IRON has seen a 1.98% return, but its three-month return is negative at -5.47%.
A key risk factor for IRON is its negative 3-month return of -5.47%, which contrasts with its STRONG ENTRY signal and 83% confidence. Furthermore, the MACD BEAR signal, alongside an RSI below 50, suggests that despite the BUY signal, the underlying momentum may be weakening or already in a bearish phase. The favorable Risk/Reward ratio of 2.0 is a positive, but the conflicting performance and technical indicators are important to consider.
#10: PTC — PTC Inc.
PTC Inc. (PTC) registers an OpportunityRadar Score of 63, with a technical score of 66 and a fundamental score of 58. The scanner provides a BUY signal, but with the lowest confidence rating among the profiled stocks at 50%, indicating a PARTIAL ENTRY. Technical indicators include an RSI of 71.0, suggesting it is in overbought territory, and a MACD BEAR signal. The stock's one-month return is 0.99%, while its three-month return is 26.97%.
PTC presents several notable risk factors. Its RSI of 71.0 positions it firmly in overbought territory, which often precedes a price correction. This is compounded by a MACD BEAR signal, indicating a bearish crossover despite the BUY signal. Furthermore, the 50% confidence rating for a PARTIAL ENTRY is the lowest among the profiled tickers, suggesting a less certain outlook from the scanner's perspective. The strong 3-month return of 26.97% is positive, but the current technical warnings and lower confidence warrant careful review.
Key Observations Across the Scan
Among the ten tickers profiled, a significant majority—seven out of ten—received a 100% confidence rating for their BUY signals, indicating a high degree of alignment across the scanner's confirmation factors. Six of the ten tickers displayed a MACD BULL signal, suggesting positive momentum for most. The average RSI for these ten stocks is approximately 60.5, positioning them generally in healthy momentum territory without being excessively overbought, with the exception of PTC at 71.0. Lumexa Imaging Holdings, Inc. (LMRI) and Genmab A/S (GMAB) showed particularly strong one-month returns of 27.18% and 28.87% respectively, with Progyny, Inc. (PGNY) also posting a notable 20.64% gain. Conversely, four tickers—COST, STE, AIZ, and PGNY—exhibited lower Risk/Reward ratios ranging from 0.4 to 0.6, potentially signaling limited upside relative to risk.
Key Risk Factors
- Conflicting Technicals and Low Confidence: PTC Inc. (PTC) shows a concerning combination of an RSI at 71.0, suggesting overbought conditions, and a MACD BEAR signal, despite a BUY signal. This is further underscored by the lowest confidence rating in the scan at 50%, indicating a PARTIAL ENTRY.
- Negative Long-Term Performance with Bearish MACD: Disc Medicine, Inc. (IRON) has a negative three-month return of -5.47%, coupled with a MACD BEAR signal and an RSI of 48.9. While it carries an 83% confidence STRONG ENTRY, the historical underperformance over the mid-term and current bearish MACD warrant careful consideration.
- Low Risk/Reward Ratios: Several tickers, including Costco Wholesale Corporation (COST), STERIS plc (STE), Assurant, Inc. (AIZ), and Progyny, Inc. (PGNY), all show Risk/Reward ratios between 0.4 and 0.6. These low figures suggest that the potential upside may be relatively limited compared to the assumed risk, even with 100% confidence BUY signals.
About Our Methodology
OpportunityRadar scans 6,600+ US stocks daily using 15+ technical indicators including RSI, MACD, Bollinger Bands, ADX, Aroon, support/resistance levels, and volume analysis, combined with fundamental metrics. Stocks are scored 0-100 with signals ranging from Accumulate to Strong Buy. Entry confidence is rated 50-100% based on 6 confirmation factors.
Disclaimer: This article is for informational purposes only and does not constitute financial advice. Past performance does not guarantee future results. Always conduct your own research and consult a qualified financial advisor before making investment decisions. Data as of November 19, 2026.
Related Articles

Disclaimer : The above information is for general informational purposes only. All information on the Site is provided in good faith, however we make no representation or warranty of any kind, express or implied, regarding the accuracy, adequacy, validity, reliability, availability or completeness of any information on the Site.