10 Stocks with Strong Buy Signals & High Confidence — November 2026
Discover 10 top-rated stocks with 'Strong Entry' buy signals and high confidence scores from OpportunityRadar's November 2026 scan. See technicals and returns.
by Kowsalya
Published Nov 13, 2026 | Updated Nov 13, 2026 | 📖 10 min read
Article continues below advertisement
OpportunityRadar Spotlights 10 Stocks with Strong Buy Signals This November
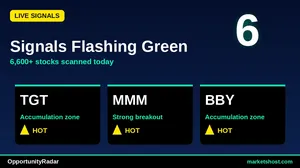
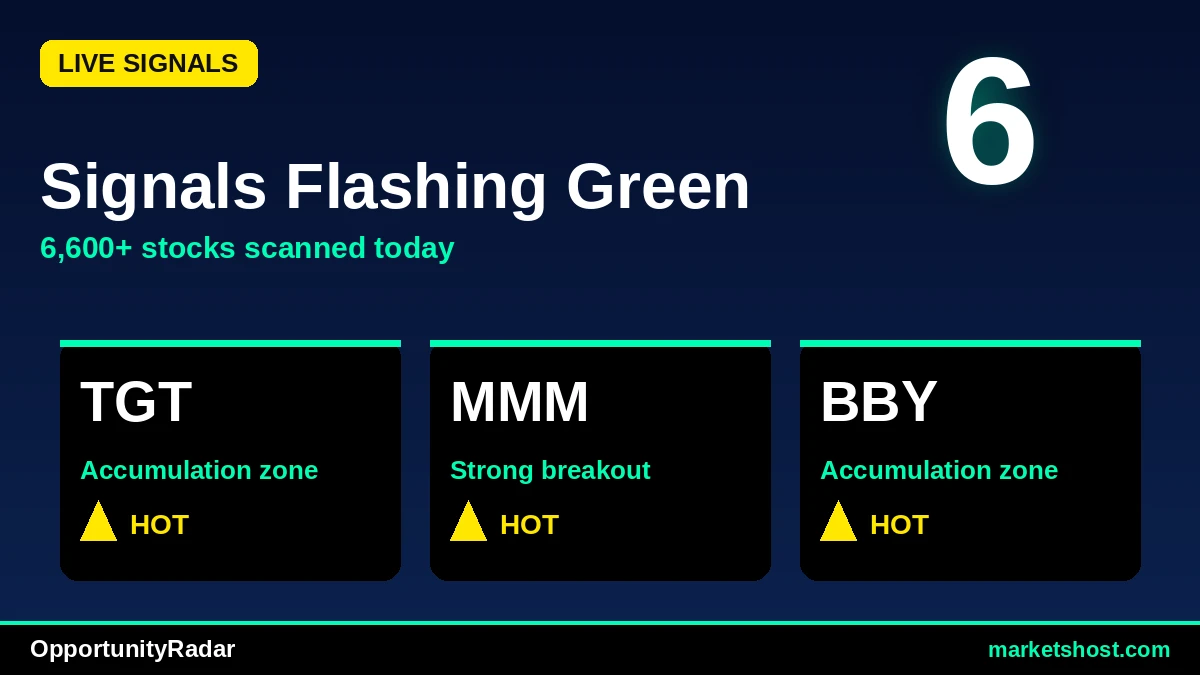
As of November 13, 2026, OpportunityRadar's scan has identified a compelling list of stocks signaling 'BUY' with high conviction. Leading this selection is Target Corporation (TGT), which registered the highest overall OpportunityRadar Score of 70, underpinned by a robust fundamental score of 75 and a technical score of 66. This signal comes with a 100% confidence rating and a 'STRONG ENTRY' recommendation. Notably, MSCI Inc. (MSCI) also stands out among the top picks, demonstrating significant recent price action with a 1-month return of 15.29% and a 3-month return of 16.58%, alongside a 100% confidence 'BUY' signal.
Across the initial 10 tickers flagged by the scanner, a consistent theme of strong buy signals emerges. Eight of these ten stocks boast a 100% confidence rating, while the remaining two, Cronos Group Inc. (CRON), Prudential Financial, Inc. (PRU), and Raymond James Financial, Inc. (RJF) each show an 83% confidence level. All ten tickers received a 'STRONG ENTRY' signal. The majority of these stocks display bullish technical indicators, with eight exhibiting a MACD BULL status. The average Relative Strength Index (RSI) for this group hovers around 56.4, indicating generally healthy momentum without being in deeply overbought territory for most.
Top 10 Signals at a Glance
| # | Ticker | Company | Price | Score | Confidence | RSI | MACD | 1-Month Return |
|---|---|---|---|---|---|---|---|---|
| 1 | TGT | Target Corporation | $159.66 | 70 | 100% | 53.2 | BULL | 3.5% |
| 2 | MMM | 3M Company | $184.7 | 67 | 100% | 58.4 | BULL | 12.11% |
| 3 | BBY | Best Buy Co., Inc. | $102.53 | 66 | 100% | 58.4 | BULL | 10.69% |
| 4 | CRON | Cronos Group Inc. Common Share | $3.36 | 66 | 83% | 48.5 | BEAR | 4.67% |
| 5 | PAG | Penske Automotive Group, Inc. | $212.47 | 65 | 100% | 55.6 | BULL | 0.02% |
| 6 | JXN | Jackson Financial Inc. | $138.35 | 65 | 100% | 56.9 | BULL | 5.95% |
| 7 | PRU | Prudential Financial, Inc. | $122.54 | 65 | 83% | 58.4 | BULL | 5.72% |
| 8 | MSCI | MSCI Inc. | $656.09 | 65 | 100% | 64.2 | BULL | 15.29% |
| 9 | RJF | Raymond James Financial, Inc. | $167.68 | 65 | 83% | 59.0 | BULL | 6.95% |
| 10 | MCO | Moody's Corporation | $509.23 | 65 | 100% | 58.1 | BULL | 4.98% |
#1: TGT — Target Corporation
Target Corporation (TGT) registers the highest OpportunityRadar Score in this scan, reaching 70. This score is supported by a strong fundamental component of 75 and a technical component of 66. The scanner issued a 'BUY' signal with a 100% confidence rating, indicating a 'STRONG ENTRY' opportunity. Technical indicators show an RSI of 53.2, suggesting neutral momentum, while the MACD is in a BULL state. Over the past month, TGT has seen a 3.5% return, with a 3-month return of 4.71%.
Despite the strong overall score and confidence, TGT's Risk/Reward ratio is 0.5. This relatively low ratio suggests that the potential reward might be limited compared to the perceived risk, based on the scanner's calculations, a factor that warrants consideration for those evaluating the 'STRONG ENTRY' signal.
#2: MMM — 3M Company
3M Company (MMM) has been flagged with an OpportunityRadar Score of 67, comprising a technical score of 73 and a fundamental score of 58. The 'BUY' signal carries a 100% confidence rating, advising a 'STRONG ENTRY'. Technical analysis indicates an RSI of 58.4, positioning it in a healthy momentum zone, and a MACD in a BULL configuration. MMM has demonstrated strong short-term performance, with a 1-month return of 12.11%, though its 3-month return is a more modest 2.08%.
The Risk/Reward ratio for MMM stands at 0.7. While the 1-month return is impressive, the lower 3-month return compared to the strong short-term surge could indicate a recent acceleration that might need further confirmation to sustain the 'STRONG ENTRY' at this Risk/Reward level.
#3: BBY — Best Buy Co., Inc.
Best Buy Co., Inc. (BBY) appears on the scanner with an OpportunityRadar Score of 66, driven by a technical score of 71 and a fundamental score of 58. The stock received a 'BUY' signal with 100% confidence and a 'STRONG ENTRY' recommendation. Technicals show an RSI of 58.4 and a MACD in a BULL state, pointing to positive price momentum. BBY has delivered robust returns, posting 10.69% over the last month and an even stronger 17.49% over the past three months.
However, BBY's Risk/Reward ratio is 0.4. This indicates a relatively constrained potential upside compared to the downside risk, despite the strong recent performance and high confidence 'BUY' signal. Investors typically seek higher Risk/Reward ratios for optimal trade setups.
#4: CRON — Cronos Group Inc. Common Share
Cronos Group Inc. (CRON) registers an OpportunityRadar Score of 66, with a technical score of 74 and a fundamental score of 53. The stock is marked with a 'BUY' signal, though its confidence rating is 83%, slightly lower than many others on this list, and it also suggests a 'STRONG ENTRY'. Its RSI is 48.5, indicating neutral to slightly weaker momentum, and notably, the MACD is in a BEAR state. CRON's 1-month and 3-month returns are identical at 4.67%.
A key divergence for CRON is the MACD BEAR signal occurring concurrently with a 'BUY' signal. This technical discrepancy, combined with an 83% confidence rating, suggests a need for cautious assessment despite the scanner's overall 'STRONG ENTRY' recommendation. The Risk/Reward ratio of 2.0, however, is the highest among the top 10, signaling a favorable potential return relative to risk.
#5: PAG — Penske Automotive Group, Inc.
Penske Automotive Group, Inc. (PAG) has an OpportunityRadar Score of 65, with its technical score at 69 and fundamental score at 58. The scanner issued a 'BUY' signal with 100% confidence and a 'STRONG ENTRY' recommendation. Current technicals include an RSI of 55.6 and a MACD in a BULL state. PAG's recent performance shows a minimal 1-month return of 0.02%, and a negative 3-month return of -1.73%.
The near-flat 1-month return and negative 3-month return for PAG, despite the 100% confidence 'BUY' signal and 'STRONG ENTRY' recommendation, present a notable point of attention. While the Risk/Reward ratio is 1.5, the absence of recent positive price momentum on a 1-month and 3-month basis could suggest a more consolidative or bottoming pattern rather than a clear upward trend.
#6: JXN — Jackson Financial Inc.
Jackson Financial Inc. (JXN) received an OpportunityRadar Score of 65, with a technical score of 71 and a fundamental score of 56. The scanner indicates a 'BUY' signal with 100% confidence and a 'STRONG ENTRY'. Technical indicators show an RSI of 56.9 and a MACD in a BULL state, pointing to positive price action. JXN has recorded a 1-month return of 5.95% and a 3-month return of 2.58%.
JXN's Risk/Reward ratio is 0.9, which is a moderate level. While the technicals and confidence are strong, the 3-month return of 2.58% is less pronounced than its 1-month performance, suggesting the recent momentum has been the primary driver of its positive returns.
#7: PRU — Prudential Financial, Inc.
Prudential Financial, Inc. (PRU) is listed with an OpportunityRadar Score of 65, featuring a technical score of 69 and a fundamental score of 58. The 'BUY' signal for PRU comes with an 83% confidence rating and a 'STRONG ENTRY' recommendation. Its RSI stands at 58.4, indicating healthy momentum, and the MACD is in a BULL state. PRU's 1-month return is 5.72%, but its 3-month return is negative at -1.61%.
The negative 3-month return for PRU, despite a positive 1-month performance and bullish MACD, suggests that recent gains are attempting to recover from a prior dip. The 83% confidence rating, while strong, is not at the 100% level seen in some other picks, which, combined with the negative longer-term return, could imply a more nuanced entry point. The Risk/Reward ratio is 0.6.
#8: MSCI — MSCI Inc.
MSCI Inc. (MSCI) holds an OpportunityRadar Score of 65, with a technical score of 70 and a fundamental score of 58. The scanner issued a 'BUY' signal for MSCI with a 100% confidence rating, indicating a 'STRONG ENTRY'. Technical analysis shows an RSI of 64.2, nearing the overbought threshold but still within a strong momentum range, and a MACD in a BULL state. MSCI has delivered exceptional returns, with a 1-month return of 15.29% and a 3-month return of 16.58%.
Despite the robust performance and high confidence, MSCI's Risk/Reward ratio is 0.4. This low ratio suggests that the potential for further upside, as calculated by the scanner, may be limited relative to the identified risk. Additionally, an RSI of 64.2 indicates strong recent buying pressure, which could eventually lead to a consolidation phase.
#9: RJF — Raymond James Financial, Inc.
Raymond James Financial, Inc. (RJF) has an OpportunityRadar Score of 65, with a technical score of 69 and a fundamental score of 58. The stock received a 'BUY' signal with an 83% confidence rating and a 'STRONG ENTRY' recommendation. Technical indicators show an RSI of 59.0 and a MACD in a BULL state. While the 1-month return is positive at 6.95%, the 3-month return is significantly negative at -6.48%.
RJF presents a challenging picture with its 3-month negative return of -6.48% contrasting with a positive 1-month return and bullish MACD. This suggests a recent recovery from a more significant downturn. The Risk/Reward ratio is 0.3, the lowest among the top 10, indicating a very limited potential reward relative to risk, which could be a significant consideration for potential entries.
#10: MCO — Moody's Corporation
Moody's Corporation (MCO) registers an OpportunityRadar Score of 65, with a technical score of 69 and a fundamental score of 58. The scanner issued a 'BUY' signal with 100% confidence and a 'STRONG ENTRY' recommendation. Technicals include an RSI of 58.1 and a MACD in a BULL state, both indicating positive momentum. MCO has seen a 1-month return of 4.98% and a 3-month return of 4.83%.
MCO's Risk/Reward ratio is 0.5. While the consistent positive returns over both 1-month and 3-month periods are favorable, a Risk/Reward ratio of 0.5 implies that the potential for significant gains might be somewhat capped compared to the identified risk, a factor to weigh against the strong confidence and 'STRONG ENTRY' signal.
Key Observations Across the Scan
- Eight out of the ten profiled tickers received a 100% confidence rating for their 'BUY' signal, indicating a high degree of alignment across the scanner's confirmation factors.
- All ten tickers were assigned a 'STRONG ENTRY' signal, suggesting immediate actionable opportunities based on the scanner's criteria.
- Eight of the ten tickers displayed a MACD BULL status, signaling positive momentum for the majority of the list.
- MSCI Inc. (MSCI) led the group with the highest 1-month return of 15.29% and also the highest 3-month return of 16.58%, showcasing strong recent performance.
- Best Buy Co., Inc. (BBY) also demonstrated robust short-term performance, with a 1-month return of 10.69% and a 3-month return of 17.49%.
- The average RSI across the top 10 tickers is approximately 56.4, indicating that most are in a healthy, trending state without being significantly overbought.
Key Risk Factors
- MACD Divergence: Cronos Group Inc. (CRON) shows a MACD BEAR signal despite receiving a 'BUY' signal with 83% confidence. This technical divergence could indicate underlying weakness or a potential false signal that warrants careful monitoring.
- Negative Longer-Term Returns: Penske Automotive Group, Inc. (PAG) and Raymond James Financial, Inc. (RJF) both exhibit negative 3-month returns (-1.73% and -6.48% respectively), even with 'BUY' signals. For RJF, its 1-month return of 6.95% suggests a recent rebound, but the significant negative 3-month performance indicates a prior downtrend from which it is attempting to recover.
- Low Risk/Reward Ratios: Raymond James Financial, Inc. (RJF) has the lowest Risk/Reward ratio at 0.3, followed by Best Buy Co., Inc. (BBY) and MSCI Inc. (MSCI) at 0.4. These low ratios suggest that the potential upside for these stocks, as calculated by the scanner, may be limited compared to the identified downside risk, a critical factor for risk-conscious investors.
About Our Methodology
OpportunityRadar scans 6,600+ US stocks daily using 15+ technical indicators including RSI, MACD, Bollinger Bands, ADX, Aroon, support/resistance levels, and volume analysis, combined with fundamental metrics. Stocks are scored 0-100 with signals ranging from Accumulate to Strong Buy. Entry confidence is rated 50-100% based on 6 confirmation factors.
Disclaimer: This article is for informational purposes only and does not constitute financial advice. Past performance does not guarantee future results. Always conduct your own research and consult a qualified financial advisor before making investment decisions. Data as of November 13, 2026.
Related Articles
Disclaimer : The above information is for general informational purposes only. All information on the Site is provided in good faith, however we make no representation or warranty of any kind, express or implied, regarding the accuracy, adequacy, validity, reliability, availability or completeness of any information on the Site.