
10 Stocks Hit 100% Confidence Buy Signals — November 17, 2026
Explore 10 stocks with high-confidence buy signals on Nov 17, 2026. TBI leads with a 42.34% 1-month return while JAKK hits a top technical score of 74.
by Kowsalya
Published Nov 17, 2026 | Updated Nov 17, 2026 | 📖 11 min read
Article continues below advertisement
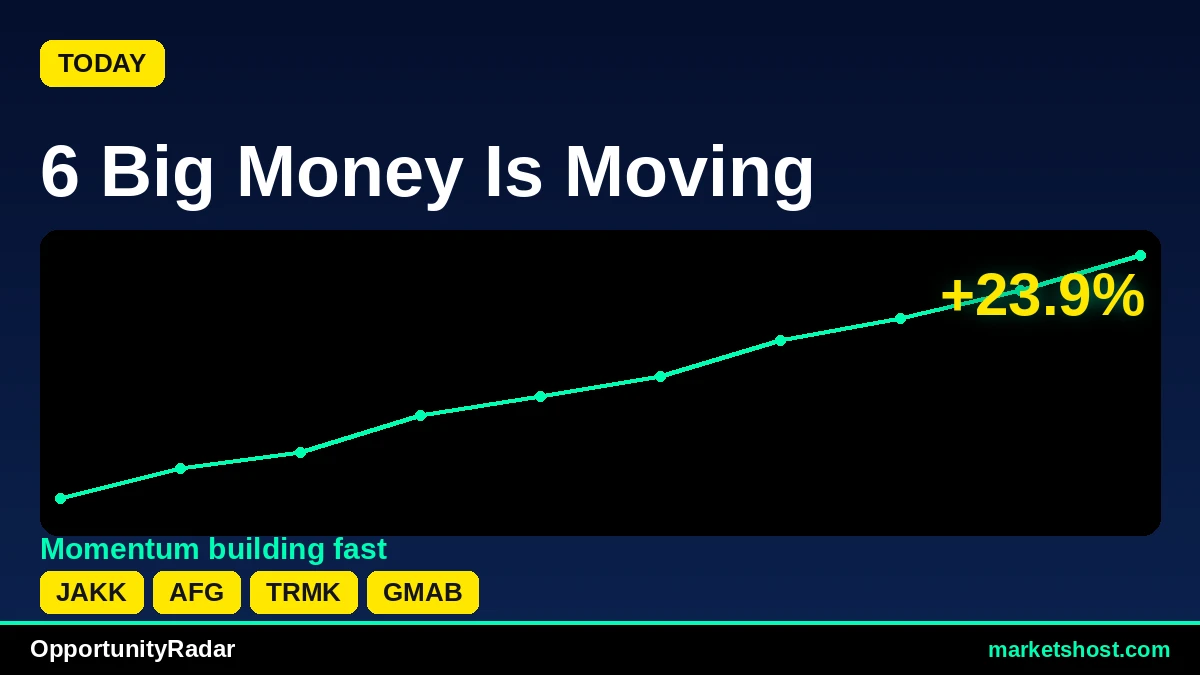
Five Tickers Reach 100% Confidence as TBI Surges 42% in 30 Days
The OpportunityRadar scanner for November 17, 2026, has identified a significant cluster of high-confidence signals, led by JAKKS Pacific, Inc. (JAKK) with an OpportunityRadar Score of 66. This score is anchored by a technical rating of 74, the highest among the top ten profiled assets today. Most notably, TrueBlue, Inc. (TBI) has registered a 42.34% return over the last month, contributing to its 100% confidence BUY signal and a technical score of 72. These numbers reflect a market environment where specific equities are demonstrating rapid price appreciation and strong technical alignment.
Across the top ten signals, exactly five tickers—JAKK, TRMK, TBI, GWW, and RSKD—have reached the maximum 100% confidence threshold. The average RSI for this group stands at 60.49, indicating a generally healthy momentum profile that remains below the traditional overbought level of 70.0 for eight of the ten stocks. While the majority of the list (80%) maintains a BULL MACD status, two tickers, GMAB and PTC, show BEAR MACD readings despite their BUY signals, representing a divergence that warrants close attention to current entry timing.
Top 10 Signals at a Glance
| # | Ticker | Company | Price | Score | Confidence | RSI | MACD | 1-Month |
|---|---|---|---|---|---|---|---|---|
| 1 | JAKK | JAKKS Pacific, Inc. | $34.83 | 66 | 100% | 64.4 | BULL | 19.28% |
| 2 | AFG | American Financial Group, Inc. | $159.02 | 65 | 83% | 64.5 | BULL | 6.55% |
| 3 | TRMK | Trustmark Corporation | $46.81 | 65 | 100% | 56.6 | BULL | 3.11% |
| 4 | GMAB | Genmab A/S | $51.76 | 65 | 83% | 60.0 | BEAR | 32.48% |
| 5 | TBI | TrueBlue, Inc. | $11.8 | 63 | 100% | 63.3 | BULL | 42.34% |
| 6 | ROIV | Roivant Sciences Ltd. | $37.76 | 63 | 83% | 49.8 | BULL | 8.15% |
| 7 | GWW | W.W. Grainger, Inc. | $1472.21 | 63 | 100% | 63.9 | BULL | 10.2% |
| 8 | PTC | PTC Inc. | $195.97 | 63 | 50% | 72.0 | BEAR | 1.36% |
| 9 | MBIN | Merchants Bancorp | $51.65 | 63 | 67% | 50.2 | BULL | 6.67% |
| 10 | RSKD | Riskified Ltd. | $9.59 | 62 | 100% | 60.2 | BULL | 9.35% |
#1: JAKK — JAKKS Pacific, Inc.
JAKKS Pacific, Inc. (JAKK) currently commands the top position in our November 17, 2026, scanner with an OpportunityRadar Score of 66. This score is comprised of a technical rating of 74 and a fundamental rating of 53. The signal is a definitive BUY with 100% confidence, indicating a STRONG ENTRY point at the current price of $34.83. Technical indicators show an RSI of 64.4, which suggests the stock is maintaining upward pressure without yet reaching the overbought threshold of 70.0. The MACD is in a BULL state, confirming the positive trend direction observed over the recent sessions.
Looking at historical performance, JAKK has delivered a 19.28% return over the last month and a 38.76% return over the last three months. The risk/reward ratio stands at 0.8, providing a specific numerical basis for entry evaluation. Investors should note that while the confidence is at its maximum, the fundamental score of 53 is the lowest among the top four tickers, suggesting the current move is heavily influenced by technical factors. The strong 3-month return of 38.76% indicates sustained interest that has accelerated in the last 30 days.
#2: AFG — American Financial Group, Inc.
American Financial Group, Inc. (AFG) presents a BUY signal with an OpportunityRadar Score of 65. The technical score of 70 and fundamental score of 58 result in an 83% confidence rating for a STRONG ENTRY. At a price of $159.02, AFG displays an RSI of 64.5, nearly identical to the top-ranked ticker, and maintains a BULL MACD status. This alignment of RSI and MACD suggests consistent price action and a stable trend. The fundamental score of 58 is among the highest in the current scan, providing a more balanced profile between technicals and valuation.
The returns for AFG are moderate compared to the broader list, with a 1-month return of 6.55% and a 3-month return of 10.7%. However, the risk/reward ratio is notable at 0.4, which is the second-lowest in the top ten. This low ratio indicates a tighter spread between the entry price and potential downside compared to high-volatility tickers. With its technical score at 70, AFG remains a high-conviction setup despite the 83% confidence rating being slightly lower than the 100% seen elsewhere in the scan.
#3: TRMK — Trustmark Corporation
Trustmark Corporation (TRMK) enters the list with a score of 65 and a 100% confidence BUY signal. The technical score is 71, paired with a fundamental score of 56. Trading at $46.81, TRMK features an RSI of 56.6, which is lower than the previous two entries, suggesting significant room for upward movement before hitting overbought levels. The MACD is currently in a BULL configuration, supporting the STRONG ENTRY designation. The 100% confidence rating reflects a high degree of harmony across the underlying technical sub-scores.
The performance data for TRMK shows a 1-month return of 3.11% and a 3-month return of 0.49%. This indicates that the stock has recently begun to accelerate, as the majority of its 90-day gains have occurred within the last 30 days. The risk/reward ratio of 0.7 is slightly higher than AFG but remains below the 1.0 threshold. The 100% confidence rating, despite the relatively flat 3-month performance, suggests that the technical indicators have aligned significantly in the most recent trading windows to trigger a maximum confidence buy signal.
#4: GMAB — Genmab A/S
Genmab A/S (GMAB) shows an OpportunityRadar Score of 65, but with a different technical profile than its predecessors. While the signal is BUY with 83% confidence and a STRONG ENTRY at $51.76, the MACD is currently in a BEAR state. This divergence is significant given the stock's RSI of 60.0. The technical score of 69 and fundamental score of 58 suggest a robust underlying structure despite the bearish MACD crossover. The fundamental score is tied for the highest in the top ten, providing a solid valuation cushion.
GMAB has demonstrated high volatility and growth, posting a 32.48% return over the past month and a 54.92% return over the last three months. This 3-month performance is the second-highest in the top ten list. The risk/reward ratio is 1.6, which is higher than the first three tickers, indicating a wider expected range of price movement. The combination of a BEAR MACD and a high 3-month return suggests that while the long-term trend is upward, there is a short-term technical conflict that investors must weigh against the 83% confidence rating.
#5: TBI — TrueBlue, Inc.
TrueBlue, Inc. (TBI) carries a score of 63 and a 100% confidence BUY signal. The technical score of 72 is the second-highest in the group, while the fundamental score is the lowest at 50. Currently priced at $11.8, TBI has an RSI of 63.3 and a BULL MACD. The STRONG ENTRY signal is backed by a massive 1-month return of 42.34%, the highest among all ten profiled tickers. This rapid price movement has driven the technical score to its current high of 72.
Over a 3-month period, TBI has returned 12.06%, meaning the bulk of its recent appreciation has been concentrated in the last 30 days. The risk/reward ratio of 1.5 reflects the increased volatility associated with such a rapid price increase. With the fundamental score at the 50-point baseline, the 100% confidence rating is heavily dependent on the strength of the 1-month momentum and the technical alignment of the RSI and MACD indicators. This ticker represents the most aggressive short-term momentum profile in the current scan.
#6: ROIV — Roivant Sciences Ltd.
Roivant Sciences Ltd. (ROIV) is marked with a score of 63 and an 83% confidence BUY signal. The technical score stands at 66, with a fundamental score of 58. At a price of $37.76, ROIV has the lowest RSI in the top ten at 49.8, placing it right at the midpoint of the neutral range. The MACD is in a BULL state, which, combined with the neutral RSI, suggests a STRONG ENTRY without the immediate risk of being overbought. The fundamental score of 58 provides a strong quantitative backing for the technical setup.
ROIV has seen an 8.15% return in the last month and a 2.51% return over the last three months. Like TRMK, the recent 30-day performance is outstripping the 90-day average, indicating a fresh upward trend. The risk/reward ratio is 1.5, matching TBI. The 83% confidence level reflects a solid technical foundation and a fundamental score that is tied for the highest in this scan. The lower RSI provides a different entry profile than the higher-momentum stocks like TBI or JAKK, as it has not yet approached the 70.0 overbought level.
#7: GWW — W.W. Grainger, Inc.
W.W. Grainger, Inc. (GWW) is the highest-priced stock in the scan at $1472.21. It holds a score of 63 with 100% confidence and a STRONG ENTRY signal. The technical score is 66 and the fundamental score is 58. Indicators show an RSI of 63.9 and a BULL MACD. GWW has maintained steady growth with a 1-month return of 10.2% and a 3-month return of 13.22%. This consistency is reflected in the 100% confidence rating, which suggests all internal technical metrics are in agreement.
A key metric for GWW is its risk/reward ratio of 0.3, which is the lowest among all ten profiled tickers. This suggests a very high level of price stability relative to its projected targets. The fundamental score of 58 is tied for the highest in the group, providing a stronger valuation basis than the lower-scoring fundamental stocks. The 100% confidence rating here is a result of consistent technical performance and a high fundamental rating, rather than the extreme price spikes seen in lower-priced tickers like TBI.
#8: PTC — PTC Inc.
PTC Inc. (PTC) presents a unique case in the top ten with a score of 63 but only a 50% confidence BUY signal, leading to a PARTIAL ENTRY recommendation. At $195.97, PTC has the highest RSI in the group at 72.0, which technically places it in overbought territory. Furthermore, the MACD is in a BEAR state. Despite these hurdles, the technical score remains 66 and the fundamental score is a strong 58. This creates a conflict between the high fundamental/technical scores and the immediate momentum indicators.
PTC's returns are 1.36% for the last month and 27.65% for the last three months. This suggests that the stock is currently consolidating or experiencing a slight pullback after a strong 90-day run. The risk/reward ratio is the highest in the group at 2.0, indicating significant potential for price swings. The 50% confidence rating is a direct reflection of the overbought RSI and the bearish MACD, which counteract the otherwise strong fundamental and technical scores, necessitating a more cautious partial entry approach.
#9: MBIN — Merchants Bancorp
Merchants Bancorp (MBIN) has a score of 63 and a 67% confidence BUY signal, designated as a standard ENTRY. The technical score is 68 and the fundamental score is 56. Trading at $51.65, MBIN has an RSI of 50.2 and a BULL MACD. Notably, MBIN is the only stock in the top ten with a negative 3-month return, currently sitting at -4.58%. However, the 1-month return has turned positive at 6.67%, suggesting a reversal of the previous downward trend.
This reversal is likely what triggered the BULL MACD and the 67% confidence rating. The risk/reward ratio is 0.9. Because the stock is still recovering from its 3-month low, the technical score of 68 indicates that the momentum is building from a lower base compared to stocks that have been consistently rising over the last 90 days. The 67% confidence level is a middle-ground rating that acknowledges the positive 1-month shift while remaining cautious about the longer-term 3-month negative performance.
#10: RSKD — Riskified Ltd.
Riskified Ltd. (RSKD) rounds out the top ten with a score of 62 and a 100% confidence BUY signal. The technical score is 68 and the fundamental score is 53. At a price of $9.59, RSKD has an RSI of 60.2 and a BULL MACD. The stock has shown significant long-term momentum, with a 3-month return of 61.18%, the highest in the entire scan. Its 1-month return is also positive at 9.35%, showing continued interest.
The STRONG ENTRY signal for RSKD is supported by this long-term momentum, though the 1-month return shows a slowing of the pace compared to the 3-month average of 61.18%. The risk/reward ratio is 1.5. With a fundamental score of 53, RSKD leans more heavily on its technical performance than its valuation metrics. The 100% confidence rating indicates that despite the slight deceleration in the last 30 days, the technical indicators remain fully aligned for a continued upward move as of the November 17 data.
Key Observations Across the Scan
Analysis of the top 10 tickers reveals several technical commonalities. Exactly 50% of the profiled stocks carry a 100% confidence rating (JAKK, TRMK, TBI, GWW, RSKD). In terms of momentum indicators, 80% of the stocks are in a BULL MACD state, while 20% (GMAB and PTC) are currently BEAR. The average RSI across the group is 60.49, with the highest being PTC at 72.0 and the lowest being ROIV at 49.8. Performance-wise, 40% of the tickers have achieved a 1-month return greater than 10% (JAKK, GMAB, TBI, GWW), with TBI leading the group at 42.34%.
Key Risk Factors
- Overbought Conditions: PTC shows an RSI of 72.0, which exceeds the standard 70.0 threshold for overbought territory. This is reflected in its lower confidence rating of 50%.
- Technical Divergence: Both GMAB and PTC exhibit a BEAR MACD despite their BUY signals. This divergence suggests that short-term momentum may be shifting against the longer-term technical scores of 69 and 66, respectively.
- Low Risk/Reward Efficiency: GWW trades with a risk/reward ratio of only 0.3. While this indicates price stability, it also suggests that the potential upside relative to the current risk levels is the lowest among all profiled tickers.
About Our Methodology
OpportunityRadar scans 6,600+ US stocks daily using 15+ technical indicators including RSI, MACD, Bollinger Bands, ADX, Aroon, support/resistance levels, and volume analysis, combined with fundamental metrics. Stocks are scored 0-100 with signals ranging from Accumulate to Strong Buy. Entry confidence is rated 50-100% based on 6 confirmation factors.
Disclaimer: This article is for informational purposes only and does not constitute financial advice. Past performance does not guarantee future results. Always conduct your own research and consult a qualified financial advisor before making investment decisions. Data as of November 17, 2026.
Related Articles
Disclaimer : The above information is for general informational purposes only. All information on the Site is provided in good faith, however we make no representation or warranty of any kind, express or implied, regarding the accuracy, adequacy, validity, reliability, availability or completeness of any information on the Site.