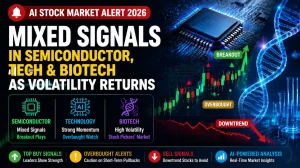
Tech & Growth Stock Signals Today: Meta, Alphabet, Reddit, Roku, Shopify & More
Latest tech stock signals: Meta, Alphabet, Reddit, Roku, and more with clear buy, sell, hold and avoid zones based on trend, momentum and risk–reward analysis.
by Kowsalya
Published May 15, 2026 | Updated May 15, 2026 | 📖 4 min read
Article continues below advertisement

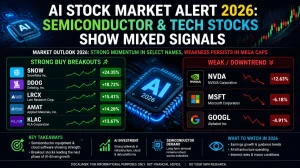
Today’s market data shows a sharp split between extended leaders like Alphabet (GOOGL), Reddit (RDDT), Roku (ROKU), and high‑momentum names such as APPS, CWAN, DOCN and FROG versus deep downtrends in SNAP, YELP, DV, SHOP and many others.
This article quickly highlights where technical conditions look strongest, where risk is elevated, and which setups are in clear “avoid” or “wait” zones so active traders can make more informed decisions.
Alphabet (GOOGL): Strong Buy, Trend Continuation
- Price: Around 400+ range with negative day change but RSI above 70 and “OVERBOUGHT”, MACD and trend indicators still BULLISH / TRENDING / GOLDEN.
- Signals: “10 – STRONG BUY”, “ENTRY”, “Trend continuation”, high win‑rate style metrics and clear take‑profit levels identified.
- Read: Powerful uptrend, but extended; better for trend traders managing risk rather than fresh value entries.
Reddit (RDDT): Strong Buy With Volume Confirmation
- Price: mid‑150s region with positive day move and neutral RSI, MACD slightly bearish but trend context still constructive.
- Signals: “4 – STRONG BUY”, “ENTRY”, “Volume confirms – high conviction”, 3/6 conditions met but flagged as actionable despite a weak R:R around 0.2:1.
- Read: Momentum name with conviction on volume, but strict risk management is essential given the low immediate reward‑to‑risk.
High‑Conviction Momentum Cluster (APPS, GRND, FROG, CWAN, DOCN, PGNY, GRPN, ROKU, DIS, WBD, FOXA, SE, YMM)
Common features across this group:
- Ratings: Frequently tagged “STRONG BUY” or “BUY” with comments like “Trend continuation”, “Breakout”, “Momentum”, “Volume confirms – high conviction”.
- RSI: Often in high‑60s to low‑70s range, sometimes explicitly “OVERBOUGHT”, signalling strong up moves but also potential for pullbacks.
- Price structure: Many show well‑defined ranges, upside targets and 1.3:1 type R:R profiles, with notes like “TIGHTEN STOP – RSI 69/70”.
Key takeaway:
These names are in established or emerging uptrends. For systematic traders, they are candidates for trend‑following with tight stops, not casual late entries.
Deep Downtrend & “Avoid” Zone: High Risk, Low Reward
A large set of tickers share the same technical story: persistent downtrend, oversold oscillators, and repeated “Strong Sell / Avoid” labels.
Classic “Avoid / Exit Now” Profiles (SNAP, DV, YELP, CARG, TREE, SHOP, WIX, TASK, NCNO, REAL and many others)
Common technical themes:
- RSI: Frequently OVERSOLD (mid‑20s or lower) but without confirmation of a reversal.
- Trend structure: “BEARISH”, “FALLING”, “DEATH” cross‑type language or “BELOW GOLDEN / WITHIN DEATH”.
- Ratings: “STRONG SELL”, often with commentary like “Strong downtrend – avoid”, “No entry — downtrend active”, “EXIT NOW”.
- Performance: Multi‑month metrics show steep negative returns (often double‑digit negative over several time frames).
Key takeaway:
Despite being oversold, these setups are trend‑down and are flagged consistently as “no‑entry” zones. They are more suitable for watchlists than fresh longs for most traders.
Neutral & Wait‑and‑Watch Setups
Meta (META): Hold, Weak Reward‑to‑Risk
- Price: High‑600s area with modest positive daily move but RSI in the mid‑30s to low‑40s and multiple labels like “NEUTRAL” and “BEARISH” in trend sections.
- Risk–Reward: Noted R:R around 0.8:1 with guidance like “HOLD – 1/6 conditions met, wait for more”.
- Overall: The stock is not flashing a clean buy or sell; it’s stuck between earlier strength and current consolidation/weakness.
“Wait” / “Hold” Cluster (PINS, PUBM, MGNI, ZETA, EDIT, VERX, GDDY, GTLB, PD and others)
Typical characteristics:
- Signals: “HOLD”, “WAIT”, “1/6 or 2/6 conditions met, wait for more”, often with poor R:R (0.2:1–0.7:1).
- Trend: Mixed — some bullish under the surface, but still falling or within DEATH zones on higher time frames.
- Interpretation: These are developing setups, not fully formed entries. Traders monitoring breakouts or basing patterns may keep them on radar rather than acting immediately.
Overbought But Strong: Ride Carefully Or Take Profits
A separate group of leaders is both technically strong and overbought, often with explicit profit‑taking suggestions.
DOCN, CWAN, SEMR, FROG, CWAN, DOCN, PGNY, CWAN‑type Profiles
- RSI: Frequently above 70 (sometimes mid‑70s) with notes like “RSI 72/73 overbought – TAKE PROFIT / TIGHTEN STOP”.
- Trend: “TRENDING”, “BULLISH”, “GOLDEN”, multi‑time‑frame gains well into double digits.
- Guidance: Many rows explicitly recommend “TAKE PROFIT”, “TIGHTEN STOP”, or signal that the move is extended and needs a pullback.
Key takeaway:
These names are leaders, not laggards, but risk of short‑term reversals is elevated. They suit disciplined traders who understand trailing stops and scaling out, rather than new, full‑size entries at stretched levels.
Quick Technical Summary Table (For Fast Scanning)
| Bucket | Typical tags | Trader action hint |
|---|---|---|
| Strong trend, overbought | GOOGL, DOCN, CWAN, PGNY, FROG | Ride trend, tighten stops |
| Strong momentum, not extreme | APPS, RDDT, GRND, ROKU, DIS, FOXA | Trend‑follow with risk caps |
| Neutral / Hold / Wait | META, PINS, PUBM, GDDY, GTLB | Watch for clearer signals |
| Deep downtrend, oversold | SNAP, DV, YELP, CARG, SHOP, WIX | Generally avoid for longs |
| Early reversal candidates | WB, COMP, DLPN, IQ‑type signals | Speculative, need confirmation |
Related Articles
Tech & Growth Stock Signals Today - FAQ's
1. Which tech stock looks strongest right now?
Alphabet (GOOGL) screens as one of the strongest names, with an overbought RSI, bullish trend structure, a “Strong Buy” rating, and “Trend continuation” commentary but it is extended, so traders often manage size and use tight stops rather than initiating aggressive new positions.
2. Which stocks are best avoided at the moment?
Stocks repeatedly tagged “Strong Sell”, “Avoid”, or “Exit now” with clearly falling trends and oversold oscillators such as SNAP, DV, YELP, CARG, TREE, SHOP and WIX — are typically considered high‑risk for new long positions until the trend actually turns.
3. What does “Strong Buy with overbought RSI” really mean?
It usually means the stock is in a powerful uptrend with strong momentum, but the risk of a pullback is higher. Trend‑followers may stay in with tight stops, while new entrants often wait for a better price or a consolidation.
Disclaimer : The above information is for general informational purposes only. All information on the Site is provided in good faith, however we make no representation or warranty of any kind, express or implied, regarding the accuracy, adequacy, validity, reliability, availability or completeness of any information on the Site.