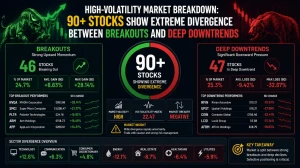
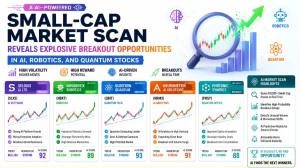
High-Volatility Market Breakdown: 90+ Stocks Show Extreme Divergence Between Breakouts and Deep Downtrends
Markets are showing extreme divergence with strong breakout momentum in quantum computing, fintech, and select space stocks, while most EV, lithium, and speculative growth stocks remain in sustained downtrends. This analysis highlights top opportunities, weak sectors, and key technical signals including RSI, MACD, trend strength, and volume confirmation.
by Kowsalya
Published Jun 24, 2026 | Updated Jun 24, 2026 | 📖 4 min read
Article continues below advertisement

The current market structure is highly fragmented, with sharp separation between strong momentum winners and deeply bearish sectors. A small group of stocks in quantum computing, fintech, and space technology are showing strong breakout momentum, while most EV, lithium, and speculative technology stocks remain in confirmed downtrends.
This is not a broad market rally. It is a high-volatility rotation phase where capital is aggressively concentrating into narrow thematic winners while avoiding weak trend assets.
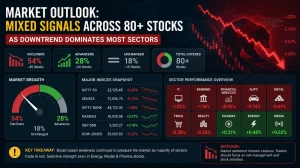
Market Overview (AI Interpretation)
Across the dataset, the dominant conditions are:
- Majority of stocks remain in weak or bearish trend structures
- RSI levels mostly range between 30–55, showing lack of strong momentum in most names
- MACD signals are largely bearish or early reversal attempts
- High volatility (>80% in many names) indicates speculative trading behavior
- Breakouts exist but are isolated, not sector-wide
Key Insight
This is a selective breakout market, not a broad index-driven trend.
Sector-Wise Breakdown
1. Quantum Computing & Advanced Tech: High Volatility Leadership
This is one of the strongest emerging momentum clusters.
Key Stocks:
- ARQQ: Extreme breakout momentum with over 100%+ ROC and strong volume confirmation
- QUBT: Stabilizing but still range-bound
- RGTI: Neutral consolidation after prior volatility spike
- QBTS: Mild bullish momentum but weak structure
- IONQ: Stronger relative strength but still corrective
Key Characteristics:
- Extremely high volatility (100%+ in many cases)
- Breakout-driven price action
- Heavy speculative participation
- Weak consistency despite strong spikes
Conclusion:
Quantum computing remains a high-risk, high-reward speculative leadership theme, not a stable trend.
2. Space & Aerospace Stocks: Mixed Momentum Cluster
Key Stocks:
- RKLB: Strong downtrend continuation
- ASTS: Weak structure, deep drawdown
- LUNR: Extended correction phase
- SPCE: Volatile but still bearish overall
- MNTS: Extremely high volatility, no stable trend
Insight:
- Most space stocks remain in distribution or correction phases
- Occasional spikes are not supported by sustained trend strength
Conclusion:
Space sector is speculative and unstable, with no broad bullish confirmation.
3. Fintech & Digital Platforms: Selective Strength
Stronger names:
- SOFI: One of the few consistent breakout structures
- HIMS: Strong trend continuation with volume support
- RSKD: Early breakout structure developing
- PAYO: Overbought but strong momentum trend
- RDDT: Neutral consolidation after earlier strength
Key Observations:
- Strong divergence within fintech sector
- A few leaders dominate while others lag
Conclusion:
Fintech is a selective momentum sector, not a uniform rally.
4. EV, Mobility & Autonomous Driving: Structural Weakness
Weak or declining stocks:
- JOBY, ACHR: Weak trend continuation
- RIVN, LCID (from broader dataset): persistent weakness
- LAZR: extreme breakdown (-50%+ move)
- INVZ, LIDR, MVIS: continued bearish structure
Key signals:
- Weak MACD across most names
- Persistent lower highs and lower lows
- OBV distribution patterns
Conclusion:
EV and mobility remain in a structural downtrend phase with no confirmed reversal strength.
5. AI & SaaS Stocks: Under Pressure
Key names:
- AI: bearish trend continuation
- PATH: weak momentum structure
- BRZE, KVYO: strong downtrend continuation
- DOCS: mild recovery attempt but weak structure
- INT A: range-bound weakness
Insight:
- SaaS valuations continue compressing
- No strong sector-wide recovery signal
Conclusion:
AI/SaaS remains defensive and under distribution pressure.
6. Crypto, Digital Assets & Infrastructure: Mixed Signals
Key stocks:
- BTDR: strong momentum but low R:R efficiency
- CORZ: breakout continuation strength
- IREN: bearish correction phase
Insight:
- Infrastructure-related crypto plays are stronger than speculative crypto names
- Still highly volatile with inconsistent trend strength
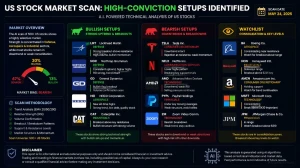
Top High-Conviction Stocks (Best Opportunities)
Strong Momentum Leaders:
- ARQQ: explosive breakout trend
- SOFI: consistent bullish structure
- OSCR: strong momentum continuation
- PAYO: overbought but strong trend support
- CORZ: breakout confirmation
- HIMS: strong trend continuation
- GH: high-volume momentum setup
Key Pattern:
These stocks show:
- Volume confirmation
- Trend alignment above SMA50
- Strong relative strength vs market
Weakest Stocks (Avoid Zone)
Strong downtrend assets:
- RKLB, ASTS, LUNR
- ACHR, JOBY
- LAZR (severe breakdown)
- BRZE, KVYO
- MVIS, LIDR, INVZ
- NFE, SOUN
Common characteristics:
- Strong negative MACD
- Persistent bearish DI structure
- Weak OBV and capital outflow
- High drawdown vs SMA200
Market Structure Insight
The market is clearly divided into three groups:
1. Breakout Leaders
- Quantum computing
- Fintech leaders
- Select crypto infrastructure
2. Weak Trend Assets
- EV sector
- SaaS under pressure
- Space stocks
3. Speculative High Volatility Zone
- Microcaps
- Meme stocks
- Low liquidity names
Trading Strategy Guidance
In this environment:
- Focus only on strong trend + volume confirmation
- Avoid averaging into downtrends
- Prioritize R:R above 1.2 only
- Breakouts must be confirmed, not speculative spikes
- Use tight stops due to volatility spikes
Related Articles
Disclaimer : The above information is for general informational purposes only. All information on the Site is provided in good faith, however we make no representation or warranty of any kind, express or implied, regarding the accuracy, adequacy, validity, reliability, availability or completeness of any information on the Site.