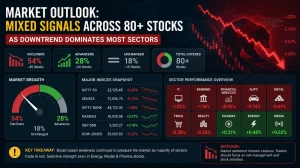
Market Outlook: Mixed Signals Across 80+ Stocks as Downtrend Dominates Most Sectors
Markets show widespread weakness across EV, clean energy, and speculative stocks, while uranium, defense, and select industrial names continue to show relative strength. This analysis highlights top opportunities, weak sectors, and actionable trading insights based on technical indicators including RSI, MACD, trend strength, and volume confirmation.
by Kowsalya
Published Jun 24, 2026 | Updated Jun 24, 2026 | 📖 4 min read
Article continues below advertisement

The current market structure reflects a highly selective and risk-averse environment. Most stocks across EV, lithium, solar, and speculative small-cap sectors are in confirmed downtrends, while only a limited group of stocks in uranium, defense, power generation, and select commodities are showing strong bullish momentum.
Overall, this is not a broad market rally. Instead, it is a rotation-driven environment where capital is concentrating into a few strong thematic sectors while exiting weaker growth segments.
Market Summary Overview
Across the dataset of more than 80 stocks, the following conditions dominate:
- Majority of stocks are in downtrend or weak trend phases
- RSI values cluster mostly between 30 and 45, indicating weak momentum
- MACD signals are predominantly bearish or early-stage recovery attempts
- Many stocks trade below key moving averages (SMA50 and SMA200 pressure)
- High volatility is present, but without broad bullish confirmation
Key Conclusion
This is a stock-picking market, not an index-driven rally. Selective momentum is more important than sector-wide exposure.
Sector-Wise Market Analysis
Uranium Sector: Strong Relative Strength
The uranium group remains one of the most consistent outperformers in the dataset.
Key stocks:
- CCJ: Strong buy signal supported by volume confirmation
- DNN: Early-stage momentum recovery
- LEU: Institutional accumulation signals visible
The sector shows:
- Stable demand-driven trend structure
- Positive volume confirmation
- Better risk-reward setups compared to other industries
Conclusion: Uranium remains one of the few structurally bullish themes.
Energy and Industrial Power: Momentum Leaders
This segment shows some of the strongest breakout behavior.
Key stocks:
- BE: Strong breakout continuation structure
- GNRC: Volume-backed momentum trend
- FCEL: High volatility but sustained upward pressure
Key characteristics:
- Strong relative strength versus market
- Institutional participation visible in volume spikes
- Breakout continuation patterns forming
Conclusion: Industrial power and energy infrastructure remain strong rotation beneficiaries.
Metals and Commodities: Mixed but Stabilizing
The metals sector shows divergence rather than uniform strength.
Key observations:
- GOLD is acting as a defensive hedge with steady momentum
- Copper-related names (FCX, SCCO) are range-bound
- Lithium names remain weak despite oversold conditions
Conclusion:
Metals are in an early stabilization phase but lack broad bullish confirmation.
EV, Lithium, and Clean Energy: Structural Weakness
This is the weakest sector group in the dataset.
Key stocks:
- TSLA, RIVN, LCID, NIO, XPEV: all in bearish structure
- TAN, ICLN, PBW, QCLN ETFs: continued downtrend pressure
- Lithium names (LAC, ALTM, SGML): oversold but not reversing
Key signals:
- Weak MACD structure across most names
- OBV trending lower (distribution phase)
- No strong reversal confirmation patterns
Conclusion:
This sector remains under sustained selling pressure with no confirmed reversal.
Speculative Small Caps: High Risk Zone
Highly speculative names show continued deterioration.
Examples:
- MULN, NKLA, GOEV, FFIE, SOLO
Characteristics:
- Extreme volatility without trend support
- Weak liquidity behavior
- No institutional confirmation
Conclusion:
These stocks remain in high-risk avoidance territory.
Best Performing Themes in Current Market
Based on technical strength and trend structure, the strongest themes are:
- Uranium and nuclear energy supply chain
- Industrial power and infrastructure growth
- Defense-related industrial momentum
- Select commodity defensive positioning
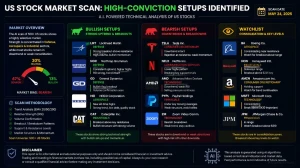
High Conviction Stocks (Relative Strength Leaders)
The strongest technical setups in the dataset include:
- CCJ: Momentum + volume confirmation
- BE: Breakout continuation trend
- GNRC: Strong institutional participation
- FCEL: High volatility but directional strength
- LEU: Emerging momentum structure
- GOLD: Defensive strength with stability
- DNN: Early reversal potential
These stocks show:
- Positive trend alignment
- Stronger volume behavior
- Better relative strength versus market
Weakest Stocks and Avoid List
The weakest segment includes:
- EV sector: TSLA, RIVN, LCID, NIO, XPEV
- Clean energy ETFs: TAN, ICLN, PBW, QCLN
- Hydrogen and speculative energy names
- Most lithium stocks (LAC, SGML, ALTM)
- Micro-cap speculative stocks
Common issues:
- Persistent downtrend structure
- Weak demand and volume
- No technical reversal confirmation
Market Structure Insight
The broader market is showing a clear pattern:
- Capital is rotating out of speculative growth sectors
- Defensive and infrastructure-related sectors are gaining relative strength
- Momentum is concentrated, not widespread
- Risk-reward quality is poor in most oversold stocks
This suggests a late-cycle correction or sector rotation phase rather than a broad bull trend.
Trading Strategy Guidance
In this environment, disciplined selection is critical:
- Focus only on stocks with confirmed trend strength
- Avoid averaging into downtrends without reversal confirmation
- Prioritize risk-reward setups above 1.2:1
- Use tight stops due to elevated volatility
- Prefer momentum continuation over bottom-fishing
Related Articles

Disclaimer : The above information is for general informational purposes only. All information on the Site is provided in good faith, however we make no representation or warranty of any kind, express or implied, regarding the accuracy, adequacy, validity, reliability, availability or completeness of any information on the Site.