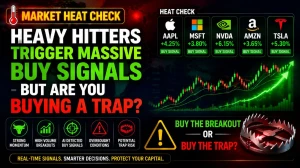
Market Heat Check: Heavy Hitters Trigger Massive Buy Signals - But Are You Buying a Trap?
Analyze the latest market data for major tickers including AAPL, NVDA, UNH, and JPM. Discover which stocks are flashing high-conviction buy signals and which overbought ETFs are flashing danger warnings.
by Kowsalya
Published Jun 16, 2026 | Updated Jun 16, 2026 | 📖 5 min read
Article continues below advertisement

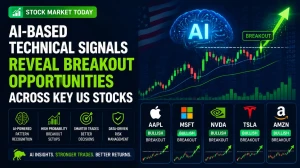
The stock market is flashing highly coordinated, algorithmic technical setups across major sectors. Recent market data shows a sharp divergence between high-flying momentum assets and beaten-down defensive plays, offering clear entry signals for some equities while flashing explicit "avoid" warnings for others. For investors looking to capitalize on high-conviction momentum, key large-cap equities and major index exchange-traded funds (ETFs) have breached significant technical breakout points, creating rapid profit windows.
Technical Performance Breakdown: Winners & Losers
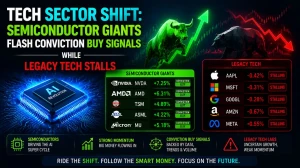
The broader markets are experiencing a classic momentum split. Tech giants like Apple ($AAPL$) and NVIDIA ($NVDA$) are finding short-term equilibrium within localized trading ranges, while high-conviction industrial, financial, and value-oriented sectors are breaking out to fresh cyclical highs.
The Breakout Leaders
- UnitedHealth Group (UNH): Exhibiting strong trend continuation with an $RSI$ of 69.2 and an $ADX$ of 41.6, confirming an incredibly powerful trending environment.
- JPMorgan Chase & Co. (JPM): Cleared critical overhead resistance on massive volume, booking a 6.50% gain over the last month and triggering a high-conviction breakout action.
- General Electric (GE): Showing remarkable momentum with a monthly return of 17.40%, holding a position well above its 50-day moving average ($SMA50$).
The Downtrend Traps to Avoid
Conversely, several prominent tickers are trapped under structural technical damage. Microsoft (MSFT) and Salesforce (CRM) are trading beneath critical moving averages, posting heavy monthly losses and showing negative Moving Average Convergence Divergence ($MACD$) histograms. Despite looking "cheap" relative to past highs, their technical indicators suggest further downside before a structural bottom is found.
Technical Indicator Cheat Sheet: Current Market Readings
To successfully navigate these setups, investors must monitor three core technical pillars:
- Relative Strength Index (RSI): Measures the speed and change of price movements. Readings above 70 indicate overbought conditions, while readings below 30 indicate oversold territory.
- Moving Average Convergence Divergence (MACD): A trend-following momentum indicator that shows the relationship between two moving averages of a stock’s price.
- Average Directional Index (ADX): Quantifies trend strength. Readings above 25 indicate a strong trend, while readings below 20 suggest a directionless, ranging market.
| Ticker | Price | RSI | MACD Call | ADX | 1M Return | Actionable Signal |
| UNH | $411.04 | 69.2 | BULLISH | 41.6 | +2.99% | STRONG BUY (Trend Continuation) |
| JPM | $319.40 | 63.2 | BULLISH | 21.3 | +6.50% | STRONG BUY (Breakout Entry) |
| NVDA | $212.45 | 51.3 | BEARISH | 16.8 | -9.88% | MONITOR (Wait for lower Entry Zone) |
| AAPL | $296.42 | 49.5 | BEARISH | 33.0 | -0.60% | MONITOR (Hold current positions) |
| MSFT | $399.76 | 42.7 | BEARISH | 17.9 | -2.36% | STRONG SELL (Avoid active downtrend) |
| CRM | $164.55 | 37.8 | BEARISH | 14.5 | -1.81% | STRONG SELL (Avoid active downtrend) |
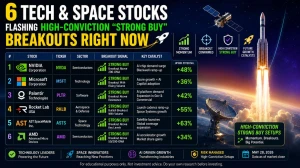
Top 3 High-Conviction Trade Setups Right Now
For active traders looking to deploy capital efficiently, these three structural setups offer the most robust statistical probability of success based on current volume and trend mechanics.
1. Northrop Grumman (NOC) - The Pure Risk/Reward Play
While defense sector peers like Lockheed Martin ($LMT$) suffer from compressed risk-to-reward ratios ($0.7:1$), Northrop Grumman is presenting an institutional-grade technical structure.
- The Setup: The stock is consolidating within a clear trending channel, maintaining an $ADX$ of 40.9.
- The Entry Strategy: Current price stands at $544.73. Look for entries inside the defined $530.88 – $548.37 buy zone.
- Targets & Risk Management: Set your initial profit target at $584.24 ($Target 1$) with an ultimate target of $768.02 ($Target 3$). Place a strict stop-loss at $525.36 to guarantee a highly favorable $2.0:1$ risk-to-reward ratio.
2. JPMorgan Chase (JPM) - The Financial Breakout
JPMorgan is leading the banking sector higher, confirming its breakout from an accumulation base with expanding volume.
- The Setup: The stock has surged to $319.40, keeping its $MACD$ firmly bullish and its $RSI$ at a sustainable 63.2.
- The Entry Strategy: If you missed the primary breakout, look to buy pullbacks toward the $290.87 – $305.90 zone.
- Targets & Risk Management: Upside targets sit at $332.28 and $338.72. Because the short-term momentum is hot, tactical traders should tighten stops to breakeven or move trailing stops to $299.46 to lock in paper gains.
3. UnitedHealth Group (UNH) - The Momentum Monster
UNH boasts the highest technical trend health score in the large-cap universe, thoroughly backed by intense institutional accumulation.
- The Setup: A massive $43.98%$ three-month return has pushed the stock to $411.04. Despite the vertical move, the stock is trading within its Bollinger Bands.
- The Entry Strategy: Avoid chasing at absolute highs. Establish exposure on retracements to the $366.66 – $392.06 corridor.
- Targets & Risk Management: Targets are mapped to $430.69 and $440.51. Maintain a trailing stop at $382.23 to ride the macro trend safely.
The Index Giants: SPY & QQQ
Both the S&P 500 ETF (SPY) and the Nasdaq-100 ETF (QQQ) have staged powerful weekly reversals, posting structural gains of $2.11%$ and $3.90%$ respectively. They are backed by active Golden Cross signals (the 50-day moving average crossing above the 200-day moving average), validating the long-term bullish bias. However, with $RSI$ metrics creeping up to the 60–63 zone, the optimal entry window has passed. The current high-probability move is to hold existing positions and pull protective stops upward to insulate capital from sudden macroeconomic shifts.
Value vs. Growth: SCHV & MGV Flash Take-Profit Warnings
For investors utilizing style-specific funds, the warning bells are ringing for value ETFs. The Schwab U.S. Large-Cap Value ETF (SCHV) and the Vanguard Mega Cap Value ETF (MGV) have officially crossed into overbought territory, posting extreme $RSI$ readings of 70.2 and 71.8 respectively.
When value assets hit these technical ceilings, momentum typically stalls. If you are sitting on short-term profits in these tickers, current data suggests scaling out or implementing a Take Profit order, expecting a near-term reversion toward their respective 50-day moving averages.
Disclaimer: Marketshost.com is a financial news publisher, not a registered investment advisor. The technical analysis, price targets, and trading strategies presented in this article are derived from quantitative historical market data and are intended solely for educational and informational purposes. Performance data from past market cycles does not guarantee future financial results. Trading equities, derivatives, and ETFs involves substantial financial risk, including the potential loss of principal capital. Always consult with a certified financial professional or perform independent fundamental research before executing any financial market transactions.
Related Articles

Disclaimer : The above information is for general informational purposes only. All information on the Site is provided in good faith, however we make no representation or warranty of any kind, express or implied, regarding the accuracy, adequacy, validity, reliability, availability or completeness of any information on the Site.