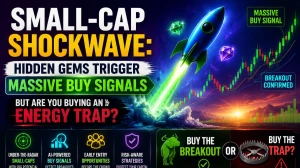
Small-Cap Shockwave: Hidden Gems Trigger Massive Buy Signals - But Are You Buying an Energy Trap?
Small-cap stocks are showing a massive style divergence. Discover why healthcare and growth small caps are flashing strong buy signals, while small-cap energy ETFs are hitting dangerous downtrend traps.
by Kowsalya
Published Jun 16, 2026 | Updated Jun 16, 2026 | 📖 6 min read
Article continues below advertisement

The small-cap landscape is flashing explosive, highly coordinated technical setups, offering nimble investors a golden window for massive alpha. Recent market data reveals a striking divergence: while specific small-cap indices and healthcare disruptors are executing high-conviction breakout patterns, the small-cap energy sector is trapped in a devastating technical meltdown. For traders looking to maximize velocity, understanding where institutional volume is actually flowing-and where it is rapidly exiting-is the key to surviving this volatile market regime.
Technical Performance Breakdown: The Small-Cap Style Divide
Small-cap equities are currently acting as a magnifying glass for the broader market's risk appetite. A massive structural rotation is underway, pushing small-cap growth, healthcare, and select aerospace names to fresh cyclical highs, while punishing commodities and cyclical energy components.
The Breakout Leaders
- Lantheus Holdings (LNTH): Exhibiting absolute institutional accumulation. Boasting a robust trend with an $ADX$ of 44.2 and an $RSI$ of 67.4, it is tightly tracking a powerful trend continuation pattern up over 8% in the last month.
- Mesa Laboratories (MOG.A): A high-flying momentum powerhouse that has surged a massive 26.91% over the past 30 days, thoroughly backed by expanding buying volume.
- iShares Russell 2000 ETF (IWM): The small-cap benchmark itself is signaling a definitive breakout from a localized ranging pattern, printing a strong "Golden Cross" buy signal as its 50-day moving average scales above its 200-day moving average.
The Energy Meltdown: Tickers to Avoid
On the flip side, small-cap energy and oilfield services are experiencing a severe algorithmic exodus. Tickers like SM Energy (SM), Matador Resources (MTDR), and Northern Oil & Gas (NOG) are collapsed beneath downward-sloping moving averages, posting heavy double-digit weekly losses. These names are firmly embedded in bearish $MACD$ territories with $ADX$ metrics confirming intense downtrend strength-making any attempt to "buy the dip" an incredibly dangerous game.
Technical Indicator Cheat Sheet: Small-Cap Momentum Readings
To safely exploit these micro-cap and small-cap movements, smart money is relying heavily on three primary automated technical anchors:
- Relative Strength Index (RSI): Evaluates price velocity. Readings climbing past 65 indicate fierce bullish momentum, but scaling over 75 warns of an immediate exhaustion risk.
- Average Directional Index (ADX): Quantifies trend velocity. A reading above 25 signifies a highly sustainable, powerful trend, whereas anything below 20 signals a choppy, trendless trading environment.
- Risk-to-Reward Ratio (R:R): The mathematical comparison between tightly calculated stop-losses and realistic overhead target resistances.
| Ticker | Price | RSI | MACD Call | ADX | 1M Return | Actionable Signal |
| MOG.A | $398.03 | 73.9 | BULLISH | 40.8 | +26.91% | STRONG BUY (Take Profit/Tighten Stops) |
| LNTH | $104.67 | 67.4 | BULLISH | 44.2 | +8.28% | STRONG BUY (Trend Continuation Entry) |
| IWM | $294.64 | 61.3 | BEARISH | 14.0 | +3.58% | STRONG BUY (Breakout Entry) |
| IBP | $208.59 | 44.0 | BULLISH | 24.9 | -4.01% | STRONG BUY (Actionable Risk/Reward Play) |
| MTDR | $51.38 | 37.9 | BEARISH | 20.6 | -11.32% | STRONG SELL (Avoid Downtrend Trap) |
| NOG | $19.96 | 32.8 | BEARISH | 27.9 | -14.55% | STRONG SELL (Explicit Exit Signal) |
Top 3 High-Conviction Small-Cap Trade Setups Right Now
Based on raw volume confirmation, statistical entry corridors, and mathematically sound risk-to-reward dynamics, these three equities present the highest-probability trading configurations on the board.
1. Installed Building Products (IBP) - The Premium Alpha Configuration
While many small caps suffer from poor entry symmetry, IBP is presenting an institutional-grade, asymmetric trade layout.
- The Technical Setup: Despite a short-term monthly pullback of -4.01%, the stock's macro technical framework is shifting. The $MACD$ has turned decisively bullish, and the $ADX$ sits at a healthy 24.9.
- The Execution Strategy: Trading at $208.59, look to accumulate shares aggressively within the defined $194.48 – $207.53 entry zone.
- Targets & Risk Management: Set your initial technical target at $246.21, with an extended target at $344.19. Place a hard stop-loss just underneath structural support at $193.01 to lock in a phenomenal $2.4:1$ risk-to-reward ratio.
2. Lantheus Holdings (LNTH) - The Healthcare Rocket
LNTH continues to display immense relative strength against the broader healthcare indexes, exhibiting a textbook trend continuation format.
- The Technical Setup: A pristine $RSI$ of 67.4 shows strong momentum without entering overbought territory, backed by an $ADX$ of 44.2 that indicates an incredibly powerful trend.
- The Execution Strategy: With the price hovering around $104.67, wait for minor intraday retracements into the $92.34 – $99.44 buying corridor.
- Targets & Risk Management: Initial profit targets sit at $111.52 and $114.95. To capture the macro trend while protecting capital, tighten trailing stops to $99.53 or move to breakeven immediately upon the next leg higher.
3. Alpha and Omega Semiconductor (AROC) - The Semi Sleeper
AROC is quietly executing a clean breakout pattern from an accumulation base, supported by a rising On-Balance Volume ($OBV$) trend.
- The Technical Setup: The stock maintains a highly constructive bullish $MACD$ cross, with its $RSI$ holding at a perfectly sustainable 52.5 level.
- The Execution Strategy: Current price is $36.29. Positions can be safely scaled into on pullbacks toward the $32.59 – $35.75 target zone.
- Targets & Risk Management: Ride the momentum toward structural upside targets of $38.49 and $39.59. Implement a strict stop-loss at $34.64 to keep risk tightly mitigated.
Small-Cap ETF Master Class: Index Breakouts vs. Overbought Alerts
For market participants who prefer utilizing exchange-traded funds to diversify individual stock risk, the small-cap ETF matrix is currently flashing highly actionable structural trading parameters.
Benchmark Breakouts: IWM, VTWO, and SCHA
The institutional small-cap proxies-iShares Russell 2000 ETF (IWM), Vanguard Russell 2000 ETF (VTWO), and Schwab U.S. Small-Cap ETF (SCHA)-are uniformly signaling a massive technical breakout. All three funds are displaying active Golden Cross formations, with their short-term 50-day moving averages tracking firmly above their long-term 200-day baselines.
However, with $RSI$ technical metrics hovering between 61 and 67, the absolute optimal entry window has temporarily closed. The mathematically correct play here is not to chase at multi-month highs, but rather to tighten trailing stop-losses to breakeven or directly beneath the $SMA50$ lines to protect accrued paper wealth from sudden macro shocks.
The Volatility Warning: SLYG Flashes "Pullback Imminent"
If you are holding style-specific small-cap growth assets, it is time to exercise extreme caution. The SPDR S&P 600 Small Cap Growth ETF (SLYG) has pushed its current price action entirely above its upper Bollinger Band, sending its $RSI$ screaming to an overbought reading of 67.6.
Historical backtests show that when small-cap growth indexes stretch this far beyond their standard deviation bands on a weak $ADX$ (17.2), a sharp mean reversion is typically around the corner. If you have short-term trading exposure in SLYG or highly correlated growth funds, data dictates waiting for a deeper pullback before deploying fresh cash.
Disclaimer: Marketshost.com is a financial news publisher, not a registered investment advisor. The technical analysis, price targets, and trading strategies presented in this article are derived from quantitative historical market data and are intended solely for educational and informational purposes. Performance data from past market cycles does not guarantee future financial results. Trading equities, derivatives, and ETFs involves substantial financial risk, including the potential loss of principal capital. Always consult with a certified financial professional or perform independent fundamental research before executing any financial market transactions.
Related Articles
Disclaimer : The above information is for general informational purposes only. All information on the Site is provided in good faith, however we make no representation or warranty of any kind, express or implied, regarding the accuracy, adequacy, validity, reliability, availability or completeness of any information on the Site.