High-Conviction Market Signals: AI Technical Scan Reveals Key Breakout & Risk Zones Across Growth and Defense Stocks
AI-powered technical stock scan reveals a highly selective US market setup, highlighting strong breakout opportunities in defense, aerospace, and industrial stocks while most equities remain in downtrend or weak consolidation phases. Full breakdown of bullish, bearish, and watchlist stocks with trend insights and risk analysis.
by Kowsalya
Published Jun 22, 2026 | Updated Jun 22, 2026 | 📖 4 min read
Article continues below advertisement

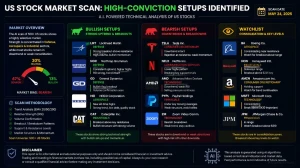
A broad AI technical scan of more than 80 US stocks shows a highly selective market environment. Most equities remain in downtrends, weak structures, or consolidation phases, while only a limited group is showing strong breakout behavior supported by volume and trend confirmation.
The key insight is that the market is not broadly bullish. Instead, it is operating in a selective momentum phase where only stocks with strong institutional participation and confirmed technical strength are sustaining upward moves.
Market Overview (AI Technical Snapshot)
AI Trend Summary
- Majority of stocks are in downtrend or avoid zones
- A smaller group is range-bound and waiting for confirmation
- A limited number of stocks are showing strong breakout momentum
Dominant Market Conditions
- Weak overall trend strength across multiple sectors
- Frequent bearish structures such as death cross formations
- Oversold RSI conditions are widespread but not producing reliable reversals
- Volume-backed breakouts are the most reliable bullish signals
High-Conviction Breakout Stocks
These stocks show the strongest combination of volume confirmation, trend alignment, and momentum continuation potential.
Defense and Industrial Strength
- BWXT: Strong breakout with volume confirmation and trend continuation
- VSEC: High-conviction breakout supported by institutional strength
- WWD: Strong momentum continuation with sustained trend structure
- GE: Powerful institutional momentum despite overbought conditions
- HWM: Stable breakout structure with strong trend support
Key observation: Defense and industrial aerospace remain the strongest consistent performers in the dataset.
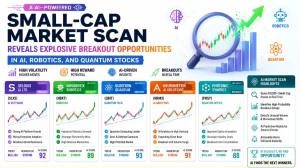
Small and Mid-Cap Momentum Leaders
- OUST: Strong breakout with rising volume trend
- DUOT: High-conviction breakout supported by momentum expansion
- INTT: Sustained breakout structure with strong trend confirmation
- SWBI: Sharp momentum surge with volume spike
- QUIK: Continued breakout structure with steady momentum
Key observation: These names show speculative rotation, but volatility risk remains high.
Space and Aerospace Segment (Selective Strength)
- SPIR: Accumulation phase with improving momentum
- NUVB: Strong continuation signal with bullish structure
Key observation: The space sector remains mixed, with only selective strength visible.
Weak Trend and Avoid Zones
These stocks remain in confirmed downtrends or structurally weak conditions.
Major Weakness List
- PLTR: Continued bearish pressure with weak structure
- KTOS: Persistent downtrend with no reversal confirmation
- AVAV: Strong sell structure and weak momentum
- LUNR: Sustained bearish trend
- BBAI: Weak structure and declining momentum
- UAVS, ASTR, GSAT: Range-bound or bearish continuation
Key observation: Oversold conditions are not triggering meaningful reversals, indicating weak buyer participation.
Featured Snippet: Current Market Signal
The current market is in a selective breakout phase where only stocks with strong volume, confirmed trend strength, and institutional participation are advancing. Most other equities remain in downtrend or consolidation phases.
Best vs Worst Setups Table
| Category | Stocks | Signal Type |
|---|---|---|
| Strong Breakouts | BWXT, VSEC, GE, OUST, DUOT | Buy / Entry |
| Momentum Trades | SWBI, QUIK, INTT | High-risk buy setups |
| Neutral / Waiting | AEVA, IRDM, GSAT | Monitor |
| Strong Downtrend | PLTR, KTOS, LUNR, AVAV | Avoid |
| Breakdown Risk | LDOS, BAH, HII | Exit / Avoid |
AI Market Insight
1. Trend structure dominates
Even oversold readings are not producing reversals, confirming that trend direction is stronger than mean-reversion behavior.
2. Volume is the key confirmation signal
Breakouts without strong volume are failing quickly. Only volume-backed moves are sustaining momentum.
3. Sector rotation is clearly visible
- Defense and aerospace are leading relative strength
- Speculative tech remains weak or mixed
- Small caps show selective momentum rather than broad participation
Risk Management Insight
Current Risk Profile
- High dispersion in volatility across sectors
- Weak overall trend consistency
- Breakouts behave as short-cycle momentum moves rather than long-term trends
Recommended Approach
- Focus only on confirmed breakout setups
- Avoid oversold reversal traps without confirmation
- Use strict stop-loss discipline
- Prefer sector leaders over lagging stocks
Disclaimer: This article is for informational and educational purposes only and should not be considered financial or investment advice. The analysis is based on technical indicators and market data, which are subject to change and may not predict future performance. Trading and investing in financial markets involve risk, including possible loss of capital. Readers should conduct their own research or consult a qualified financial advisor before making any investment decisions.
Related Articles


Disclaimer : The above information is for general informational purposes only. All information on the Site is provided in good faith, however we make no representation or warranty of any kind, express or implied, regarding the accuracy, adequacy, validity, reliability, availability or completeness of any information on the Site.