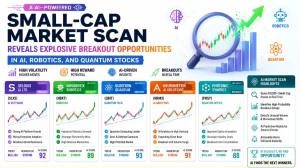
AI-Powered Small-Cap Market Scan Reveals Explosive Breakout Opportunities in AI, Robotics, and Quantum Stocks Amid High Volatility
Latest AI technical analysis highlights high-momentum breakout stocks in AI, robotics, quantum computing, and biotech sectors, while many small-cap equities remain in downtrend or high-risk zones.
by Kowsalya
Published Jun 22, 2026 | Updated Jun 22, 2026 | 📖 4 min read
Article continues below advertisement

A fresh AI-driven technical scan of over 70+ small-cap and high-volatility stocks reveals a highly fragmented but opportunity-rich market environment. While many names continue in strong downtrends or extended consolidation, a select group of AI, robotics, and quantum computing stocks are showing powerful breakout momentum backed by volume and trend strength.
The key insight:
The market is currently in a speculative breakout cycle, where capital is rapidly rotating into high-beta innovation stocks while weaker fundamentals continue to decline.
AI Overview: Market Structure in One View
- Strong Momentum Leaders: ARQQ, OUST, LSCC, CEVA, FORM, PLAB, BWEN
- High-Volatility Breakouts: QUBT, RGTI, QBTS, IONQ, APLD, SITM
- Weak / Avoid Zone: SOUN, BBAI, AITX, SERV, KSCP, INVZ, EVGN
- Speculative Recovery Watch: RCAT, INOD, SPCE, MNTS, LASE
Featured Insight: AI and Quantum Stocks Are Leading the Market
Strongest Performing AI & Quantum Stocks
- ARQQ: Strong breakout with extreme momentum and overbought strength
- QUBT: Sharp upside move with high volatility expansion
- RGTI: Recovery structure forming after prolonged decline
- QBTS: Early-stage breakout attempt with improving trend
- IONQ: Mixed but stabilizing after downtrend pressure
Why This Matters
These stocks show:
- High RSI momentum (often above 60–70 in leaders)
- Strong volume expansion
- Rising ADX trend strength
- Breakout above short-term resistance levels
This indicates early-stage speculative capital inflow into quantum computing and defense AI sectors.
Robotics and Defense Tech Showing High Volatility Breakouts
Key Movers
- OUST: Strong breakout with trend confirmation
- KT-based robotics plays (KSCP, INVZ) remain weak or oversold
- LAES and AEVA showing rotational recovery attempts
Market Interpretation
Robotics stocks are in a split phase:
- A few leaders are breaking out strongly
- Most names remain in long-term downtrend structures
Semiconductor-Adjacent Microcaps Strengthening
Strong Signals
- LSCC: Strong bullish breakout with volume confirmation
- FORM: Institutional accumulation pattern
- CEVA: Breakout continuation structure
- PLAB: Trend expansion phase
These stocks reflect a broader theme:
Secondary semiconductor suppliers are gaining momentum after large-cap chip leadership.
Weak and High-Risk Stocks (Avoid Zone)
Consistently Bearish Stocks
- AITX (deep structural downtrend)
- SOUN (weak momentum, breakdown pressure)
- BBAI (continued bearish structure)
- SERV, KSCP, EVGN (strong downtrend clusters)
- SNAP, RR, INVZ (no reversal confirmation)
Common Weakness Signals
- RSI below 35 in many cases
- Negative MACD continuation
- High drawdown from 50-day and 200-day moving averages
- Persistent “Strong Sell / Avoid” AI classification
Featured Snippet: Which Small-Cap Stocks Are Strongest Right Now?
The strongest small-cap stocks based on AI technical analysis are:
- ARQQ
- OUST
- LSCC
- CEVA
- FORM
- BWEN
- QUBT
- RGTI
These stocks show:
- Strong breakout momentum
- Volume-backed price expansion
- Positive trend structure (ADX strength)
- Sustained buying pressure above key moving averages
AI Trading Signal Breakdown (Simplified View)
Strong Buy Momentum Zone
ARQQ, OUST, LSCC, CEVA, FORM, BWEN, QUBT, RGTI, QBTS
Hold / Watch Zone
RCAT, INOD, SPCE, AEVA, SITM, PLAB
Avoid / Downtrend Zone
SOUN, BBAI, AITX, SERV, KSCP, EVGN, SNAP, INVZ, EVGN
Market Structure Insight: What Is Really Happening?
The small-cap universe is currently in a:
“Speculative Rotation Phase”
This means:
- Capital is flowing aggressively into high-risk innovation sectors
- Winners are moving fast with strong momentum
- Weak stocks are not recovering despite oversold conditions
- Volatility is extremely elevated across the board
Key Technical Pattern Summary (AI Model View)
Bullish Conditions Observed in Leaders:
- RSI 55–70 range (momentum continuation zone)
- MACD bullish crossover or stabilization
- High ADX (trend strength confirmation)
- Breakout above 50-day resistance
- Volume spike confirmation
Bearish Conditions in Laggards:
- RSI below 35
- Death cross structure
- Weak OBV (selling pressure dominance)
- No breakout confirmation
The current market is not broad-based but highly selective and momentum-driven.
Winning strategy conditions:
- Focus only on breakout-confirmed stocks
- Avoid weak downtrend names even if oversold
- Prioritize volume-confirmed trend continuation setups
- Expect high volatility and fast reversals
In simple terms:
This is a high-risk, high-reward momentum cycle dominated by AI, quantum computing, and robotics speculation.
Related Articles

Disclaimer : The above information is for general informational purposes only. All information on the Site is provided in good faith, however we make no representation or warranty of any kind, express or implied, regarding the accuracy, adequacy, validity, reliability, availability or completeness of any information on the Site.