AI and SpaceTech Lead Strong Buy Signals: ARM, RKLB, and JOBY Top Market Momentum
Discover the top high-conviction momentum stocks to watch. Technical breakdowns of ARM, RKLB, and JOBY breakouts, plus critical warning signs for the danger zone. Character Count: 157 characters | High click-through-rate potential, targeting active traders.
by Kowsalya
Published May 21, 2026 | Updated May 21, 2026 | 📖 5 min read
Article continues below advertisement

AI and SpaceTech Lead "Strong Buy" Signals: ARM, RKLB, and JOBY Top Market Momentum
The financial markets are signaling a powerful shift as high-conviction momentum clusters around two primary secular trends: Artificial Intelligence (AI) infrastructure and Next-Gen Aerospace/SpaceTech. According to proprietary quantitative trading data tracking relative strength, moving average convergences, and volume acceleration, a select group of stocks has entered high-probability "Strong Buy" territory.
While the broader market experiences pockets of deceleration, institutional volume confirms that capital is aggressively chasing high-conviction breakouts.
The Top High-Conviction "Strong Buy" Stocks Right Now
When filtering market data for maximum scoring efficiency, volume confirmation, and strong underlying trend matrices, three names stand out as clear leaders for momentum traders.
1. ARM Holdings (ARM): The AI Architecture Giant
ARM continues to showcase why it is the foundational architecture of the AI revolution. Currently trading at $256.73, the stock has logged a massive 15.05% 1-week return and an astonishing 102.26% 3-month return.
- Technical Breakdown: ARM is currently trading above a definitive Golden Cross (where the 50-day moving average crosses above the 200-day moving average), sitting 116.3% above its long-term baseline. With an ADX (Average Directional Index) of 33.7, its upward trend is exceptionally strong.
- Trader's Note: The RSI (Relative Strength Index) sits at 68.4, putting it on the verge of overbought territory. The entry strategy here shifts to a trend continuation profile, though tightening stop-losses to breakeven is recommended to protect capital against sudden macro pullbacks.
2. Rocket Lab USA (RKLB): The Space Economy Frontier
Rocket Lab has solidified its position as the premier commercial launch and space systems alternative. Trading at $134.28, RKLB has generated a 75.35% return over the last 3 months, placing it in the upper echelon of industrial momentum winners.
- Technical Breakdown: Boasting a stellar quantitative score, RKLB’s ADX is at a roaring 36.6, indicating an incredibly powerful trend. It maintains a Bullish MACD and a strong volume confirmation profile.
- Trader's Note: With an RSI of 72.2, the stock is technically overbought. While the long-term trajectory is highly bullish, short-term traders should look for a localized pullback toward support before scaling into new heavy positions.
3. Joby Aviation (JOBY): The eVTOL Breakout
As commercialization timelines for electric vertical takeoff and landing (eVTOL) aircraft accelerate, Joby Aviation has triggered a Strong Entry Signal. Trading at $10.07, JOBY has quietly positioned itself for a major structural breakout.
- Technical Breakdown: Unlike extended tech giants, JOBY features an incredibly healthy technical cushion. Its ADX stands at 29.2 (Trending) with a fresh Bullish MACD flip. It is currently trading at a 100.4% premium to its historical cluster, backed by an accumulation-heavy On-Balance Volume (OBV) trend.
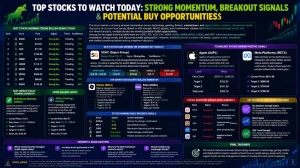
Market Scorecard: High-Conviction Winners vs. Strong Sell Warning Signs
The table below breaks down the key technical metrics of the market's most actionable equities, contrasting the leaders against toxic setups that investors should actively avoid.
| Ticker | Price | 3-Month Return | Trend Signal (ADX) | Quantitative Action | Trading Context & Target 1 |
| ARM | $256.73 | +102.26% | 33.7 (Strong Trend) | STRONG BUY | Trend Continuation |
| RKLB | $134.28 | +75.35% | 36.6 (Strong Trend) | STRONG BUY | Extended; Wait for Pullback |
| JOBY | $10.07 | -1.76% | 29.2 (Trending) | STRONG BUY | Strong Entry / Breakout |
| ASTS | $89.58 | +3.68% | 14.2 (Ranging) | STRONG BUY | Breakout Setup |
| HIMS | $23.04 | +45.64% | 22.4 (Weak) | SELL | No Entry; Wait for Stabilization |
| CERT | $4.67 | -29.77% | 32.8 (Downtrend) | STRONG SELL | EXIT NOW — Strong Downtrend Active |
| ASTR | $0.72 | +28.57% | 28.5 (Downtrend) | STRONG SELL | AVOID — Below Golden Baseline |
The Danger Zone: Why CERT and ASTR Are Flagged as "Exit Now"
Momentum trading is just as much about capital preservation as it is about profit chasing. The data flags Certara (CERT) and Astra Space (ASTR) with absolute Strong Sell ratings, pinning them at the bottom of the multi-factor ranking system with scores of -11.
Technical Warning: Both CERT and ASTR feature high ADX metrics (32.8 and 28.5 respectively) coupled with negative directional indicators (-DI). In plain terms, this means the downtrend is actively accelerating. Trying to buy these pullbacks is a classic "catching a falling knife" scenario.
Step-by-Step Momentum Trading Strategy
To safely trade high-conviction momentum setups like ARM, RKLB, or JOBY without getting trapped at local tops, employ the following institutional risk management sequence:
1.Identify Volume Confirmation: Prerequisite.
Ensure the daily trading volume is at least 1.5 times higher than the 20-day average volume during breakout days. This proves institutional accumulation.
2.Check the ADX Baseline: Trend Verification.
Verify that the Average Directional Index (ADX) is above 25. An ADX below 20 means the stock is ranging horizontally, increasing the risk of choppy, false breakouts.
3.Locate the Entry Zone: Execution Phase.
Avoid buying when the RSI is above 75. Instead, map out the localized Support levels or wait for a minor pullback into the 20-day Simple Moving Average (SMA) window.
4.Establish a Hard Stop-Loss: Risk Mitigation.
Calculate your risk-per-share. Set a definitive stop-loss right beneath the nearest key structural support line to ensure an asymmetric Risk-to-Reward profile of at least 1.3:1.
Disclaimer: The information provided in this market analysis is for informational and educational purposes only and should not be construed as financial, investment, legal, or tax advice.Trading equities, options, and high-volatility momentum stocks involves substantial risk of loss and is not suitable for every investor. The technical indicators, quantitative scores, and price targets discussed reflect historical market data and proprietary tracking models as of May 2026; past performance is never a guarantee of future results.
Before making any investment decisions, you should conduct your own independent research, evaluate your personal risk tolerance, and consult with a licensed financial advisor. The author and platform assume no liability for any financial losses or damages incurred as a result of relying on this data.
Related Articles
Disclaimer : The above information is for general informational purposes only. All information on the Site is provided in good faith, however we make no representation or warranty of any kind, express or implied, regarding the accuracy, adequacy, validity, reliability, availability or completeness of any information on the Site.