10 Stocks with Strong Buy Signals & High Returns — June 2026
MarketsHost.com's June 2026 scan highlights 10 stocks, including WDC with 149.79% 3M returns and 100% confidence, and MS at $224.05 with a 68 score.
by Kowsalya
Published Jun 25, 2026 | Updated Jun 25, 2026 | 📖 10 min read
Article continues below advertisement

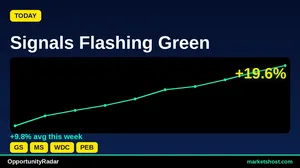
OpportunityRadar Uncovers 10 Potential Buy Signals Amidst Shifting Market Dynamics
Western Digital Corporation (WDC) emerges as a notable highlight from today's OpportunityRadar scan, signaling a 'STRONG BUY' with a perfect 100% confidence rating and a 'STRONG ENTRY' indication. Priced at $682.8, WDC has demonstrated exceptional performance, posting a 28.68% return over the last month and an impressive 149.79% gain over the past three months. Its OpportunityRadar Score of 67 is underpinned by a strong technical component of 75, suggesting robust upward momentum.
This June 25, 2026 scan reveals a landscape dominated by 'BUY' signals, with 8 out of the top 10 profiled tickers receiving a 100% confidence rating, indicating strong conviction across the platform's criteria. The average RSI for these top 10 opportunities stands at 62.02, generally in healthy territory below overbought levels, while 8 of the 10 also show a bullish MACD configuration. These metrics collectively point to a period of sustained positive momentum for many of the identified stocks.
Top 10 Signals at a Glance
| # | Ticker | Company | Price | Score | Confidence | RSI | MACD | 1-Month Return |
|---|---|---|---|---|---|---|---|---|
| 1 | GS | Goldman Sachs Group, Inc. (The | $1090.03 | 68 | 67% | 61.1 | BEAR | 9.39% |
| 2 | MS | Morgan Stanley | $224.05 | 68 | 100% | 63.8 | BULL | 11.13% |
| 3 | WDC | Western Digital Corporation | $682.8 | 67 | 100% | 62.9 | BULL | 28.68% |
| 4 | PEB | Pebblebrook Hotel Trust | $18.77 | 64 | 100% | 67.8 | BULL | 21.21% |
| 5 | SNX | TD SYNNEX Corporation | $282.38 | 63 | 67% | 64.9 | BEAR | 14.44% |
| 6 | DRI | Darden Restaurants, Inc. | $211.83 | 63 | 100% | 60.3 | BULL | 2.87% |
| 7 | MUC | Blackrock MuniHoldings Califor | $10.89 | 63 | 100% | 60.0 | BULL | 1.44% |
| 8 | SEPN | Septerna, Inc. | $34.79 | 63 | 100% | 60.3 | BULL | 16.78% |
| 9 | FAST | Fastenal Company | $46.76 | 62 | 100% | 58.0 | BULL | 4.34% |
| 10 | ESI | Element Solutions Inc. | $47.16 | 62 | 100% | 61.1 | BULL | 9.9% |
#1: GS — Goldman Sachs Group, Inc. (The
Goldman Sachs Group, Inc. (GS) is currently priced at $1090.03, registering an OpportunityRadar Score of 68. This score is bifurcated into a technical component of 63 and a fundamental component of 75, indicating a stronger fundamental outlook according to the scan. The platform issues a 'BUY' signal for GS with a 67% confidence rating and an 'ENTRY' status.
From a technical perspective, GS's Relative Strength Index (RSI) is 61.1, suggesting it is not yet in overbought territory. However, its MACD indicator is currently in 'BEAR' territory, which presents a divergence from the 'BUY' signal and warrants careful consideration. Furthermore, the Risk/Reward ratio for GS is 0.3, indicating a relatively limited potential upside compared to the associated risk, based on the platform's assessment.
#2: MS — Morgan Stanley
Morgan Stanley (MS) trades at $224.05 and holds an OpportunityRadar Score of 68. The technical score for MS is 74, while its fundamental score is 58, suggesting a stronger technical impetus for its current rating. The scan generates a 'BUY' signal with a robust 100% confidence level and a 'STRONG ENTRY' recommendation, highlighting a high degree of conviction in this opportunity.
Technically, MS displays an RSI of 63.8, positioning it in a healthy, trending zone. The MACD indicator is 'BULL', aligning with the strong buy signal and indicating positive momentum. Over the past month, MS has gained 11.13%, and over three months, it has returned 37.26%, reflecting significant recent appreciation. However, its Risk/Reward ratio of 0.3 suggests that while the signal is strong, the potential upside relative to risk might be constrained.
#3: WDC — Western Digital Corporation
Western Digital Corporation (WDC) is priced at $682.8, carrying an OpportunityRadar Score of 67. The technical component of this score is 75, significantly higher than its fundamental component of 55, pointing to strong technical factors driving its current position. The platform has issued a 'STRONG BUY' signal for WDC, backed by a 100% confidence rating and a 'STRONG ENTRY' indication, reflecting high conviction.
WDC's technical indicators are supportive, with an RSI of 62.9 and a MACD in 'BULL' territory, suggesting sustained upward momentum. The stock has shown exceptional performance, with a 28.68% return over the last month and an impressive 149.79% gain over the past three months. The Risk/Reward ratio for WDC stands at 1.7, which is a more favorable ratio compared to some other opportunities on this list, indicating a potentially balanced risk-adjusted return profile.
#4: PEB — Pebblebrook Hotel Trust
Pebblebrook Hotel Trust (PEB) is trading at $18.77, with an OpportunityRadar Score of 64. Its technical score is 69, and its fundamental score is 56. The scan has identified a 'BUY' signal for PEB, accompanied by a 100% confidence rating and a 'STRONG ENTRY' indication, suggesting a high level of certainty in the signal.
The technical picture for PEB shows an RSI of 67.8, which is approaching the upper bounds of the typical range, indicating strong buying interest. Its MACD is in 'BULL' territory, reinforcing the positive momentum. PEB has delivered substantial returns, with a 21.21% gain over the last month and a 47.83% increase over the past three months. However, the Risk/Reward ratio is 0.4, which is on the lower side, implying that while the stock has strong momentum, the potential for further gains relative to risk may be limited according to the platform's assessment.
#5: SNX — TD SYNNEX Corporation
TD SYNNEX Corporation (SNX) is priced at $282.38, with an OpportunityRadar Score of 63. Its technical score is 66, and its fundamental score is 58. The platform has generated a 'BUY' signal for SNX, with a confidence level of 67% and an 'ENTRY' status.
Examining the technical indicators, SNX has an RSI of 64.9, indicating healthy momentum. However, similar to GS, its MACD is in 'BEAR' territory despite the 'BUY' signal, which could signal a potential short-term pullback or a loss of bullish strength. Despite this, the stock has posted strong recent returns, with a 14.44% gain over one month and a significant 76.89% increase over three months. The Risk/Reward ratio for SNX is 0.5, suggesting a moderate potential return relative to risk.
#6: DRI — Darden Restaurants, Inc.
Darden Restaurants, Inc. (DRI) is trading at $211.83, holding an OpportunityRadar Score of 63, with a technical score of 66 and a fundamental score of 58. The scan has issued a 'BUY' signal for DRI, backed by a 100% confidence rating and a 'STRONG ENTRY' recommendation, reflecting a high degree of certainty in the signal.
Technically, DRI's RSI stands at 60.3, indicating that it is trending positively without being overextended. Its MACD is in 'BULL' territory, which aligns with the buy signal and suggests ongoing positive momentum. While its 1-month return of 2.87% and 3-month return of 6.52% are positive, they are relatively modest compared to some other high-performing stocks on this list. The Risk/Reward ratio for DRI is 0.4, suggesting a lower potential upside relative to the identified risk.
#7: MUC — Blackrock MuniHoldings Califor
Blackrock MuniHoldings Califor (MUC) is priced at $10.89 and has an OpportunityRadar Score of 63. Its technical score is 70, while its fundamental score is 53. The platform has identified a 'BUY' signal for MUC, with a perfect 100% confidence rating and a 'STRONG ENTRY' status, indicating strong alignment across its assessment criteria.
MUC's technical indicators include an RSI of 60.0, suggesting a stable, positive trend. The MACD is in 'BULL' territory, supporting the 'BUY' signal. Over the past month, MUC has seen a 1.44% return, and over three months, it has gained 4.66%. While these returns are more modest than some other entries, the standout feature for MUC is its Risk/Reward ratio of 2.0, which is among the highest on this list, implying a potentially attractive return for the level of risk identified by the platform.
#8: SEPN — Septerna, Inc.
Septerna, Inc. (SEPN) is currently trading at $34.79, with an OpportunityRadar Score of 63. Its technical score is 72, and its fundamental score is 50. The scan has generated a 'BUY' signal for SEPN, accompanied by a 100% confidence rating and a 'STRONG ENTRY' indication, signaling strong conviction in this opportunity.
From a technical standpoint, SEPN's RSI is 60.3, suggesting healthy upward momentum without being overbought. The MACD is in 'BULL' territory, aligning with the buy signal. SEPN has delivered robust recent performance, with a 16.78% return over the last month and a 40.62% gain over the past three months. The Risk/Reward ratio for SEPN is 0.9, indicating a near one-to-one potential return for the identified risk, which is a balanced profile.
#9: FAST — Fastenal Company
Fastenal Company (FAST) is priced at $46.76, holding an OpportunityRadar Score of 62. Its technical score is 64, and its fundamental score is 58. The platform has issued a 'BUY' signal for FAST, with a 100% confidence rating and a 'STRONG ENTRY' indication, highlighting a high degree of certainty in the signal.
Technically, FAST's RSI is 58.0, indicating a steady, positive trend. The MACD is in 'BULL' territory, reinforcing the buy signal. FAST has posted a 4.34% return over the last month and a 3.67% gain over the past three months. While these returns are positive, they are relatively conservative compared to some other stocks on this list. The Risk/Reward ratio for FAST is 0.3, suggesting a lower potential upside relative to the identified risk, which is a factor for consideration.
#10: ESI — Element Solutions Inc.
Element Solutions Inc. (ESI) is trading at $47.16, with an OpportunityRadar Score of 62. Its technical score is 65, and its fundamental score is 58. The scan has generated a 'BUY' signal for ESI, with a 100% confidence rating and a 'STRONG ENTRY' indication, reflecting strong conviction in this opportunity.
ESI's technical indicators include an RSI of 61.1, suggesting a healthy upward trend. The MACD is in 'BULL' territory, aligning with the buy signal and indicating positive momentum. ESI has delivered solid recent performance, with a 9.9% return over the last month and a 38.79% gain over the past three months. The Risk/Reward ratio for ESI is 0.4, indicating that while the signal is strong, the potential for further gains relative to risk might be limited according to the platform's assessment.
Key Observations Across the Scan
- Out of the 10 profiled tickers, 8 received a 100% confidence rating, signaling strong conviction from the OpportunityRadar platform.
- A significant majority, 8 of the 10 tickers, displayed a 'BULL' MACD configuration, indicating positive price momentum.
- The average RSI across these 10 tickers is 62.02, generally indicating healthy, trending conditions without being in overbought territory.
- Four tickers (MS, WDC, PEB, SNX) registered 1-month returns exceeding 10%, with WDC leading at 28.68%.
- WDC (149.79%) and SNX (76.89%) showed exceptional 3-month returns, highlighting strong recent price appreciation.
- MUC stands out with the highest Risk/Reward ratio at 2.0 among the profiled stocks, followed by WDC at 1.7.
Key Risk Factors
- MACD Divergence: Goldman Sachs (GS) and TD SYNNEX Corporation (SNX) both show a 'BEAR' MACD despite receiving 'BUY' signals. This divergence between the overall signal and a key momentum indicator like MACD warrants careful monitoring, as it could suggest weakening bullish momentum or a potential short-term reversal despite the broader buy recommendation.
- Lower Risk/Reward Ratios: Several profiled tickers, including GS (0.3), Morgan Stanley (MS) (0.3), Fastenal Company (FAST) (0.3), Darden Restaurants (DRI) (0.4), and Element Solutions Inc. (ESI) (0.4), exhibit relatively low Risk/Reward ratios. This indicates that the potential upside, as assessed by the OpportunityRadar platform, is comparatively limited when weighed against the identified risk, suggesting a less favorable risk-adjusted return profile for these particular opportunities.
- Limited Fundamental Data: For all profiled tickers, several fundamental metrics such as P/E, EPS, Debt/Equity, and earnings/revenue growth are listed as 'N/A'. The absence of this key financial data restricts a comprehensive fundamental assessment, meaning investment decisions would rely primarily on the available technical and OpportunityRadar scores, which introduces an element of incomplete information.
About Our Methodology
OpportunityRadar scans 6,600+ US stocks daily using 15+ technical indicators including RSI, MACD, Bollinger Bands, ADX, Aroon, support/resistance levels, and volume analysis, combined with fundamental metrics. Stocks are scored 0-100 with signals ranging from Accumulate to Strong Buy. Entry confidence is rated 50-100% based on 6 confirmation factors.
Disclaimer: This article is for informational purposes only and does not constitute financial advice. Past performance does not guarantee future results. Always conduct your own research and consult a qualified financial advisor before making investment decisions. Data as of June 25, 2026.
Related Articles
Disclaimer : The above information is for general informational purposes only. All information on the Site is provided in good faith, however we make no representation or warranty of any kind, express or implied, regarding the accuracy, adequacy, validity, reliability, availability or completeness of any information on the Site.