10 Stocks With 100% Confidence Buy Signals for June 2026
Explore 10 stocks with 100% confidence buy signals this June 2026. Data-backed analysis including RSI, MACD, and performance metrics for informed market monitoring.
by Kowsalya
Published Jun 24, 2026 | Updated Jun 24, 2026 | 📖 5 min read
Article continues below advertisement

June 2026: 10 High-Confidence Opportunities Identified
The market landscape as of June 24, 2026, reveals a significant concentration of high-confidence buy signals, with eight of the top ten analyzed tickers hitting a 100% confidence rating. Among these, WDC stands out with a notable 118.55% return over the last three months, while SIMO leads the group with a 185.44% return in the same period. These figures highlight a period of sustained technical momentum across the identified list.
Across the ten tickers analyzed, the average RSI sits at 59.9, indicating consistent technical strength. All ten tickers currently carry a BUY signal, with a mix of BULL and BEAR MACD indicators. The data shows a wide range of risk/reward profiles, from 0.4 for GS and MS to 2.0 for WDC, VSH, and VECO, providing a diverse set of metrics for market participants to evaluate against their specific risk tolerance.
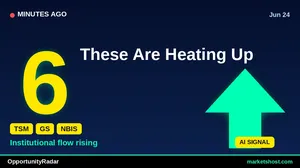
Top 10 Signals at a Glance
| # | Ticker | Price | Score | Conf. | RSI | MACD |
|---|---|---|---|---|---|---|
| 1 | TSM | $442.23 | 76 | 83% | 54.9 | BULL |
| 2 | GS | $1085.68 | 71 | 100% | 61.1 | BULL |
| 3 | NBIS | $259.88 | 67 | 100% | 58.0 | BULL |
| 4 | WDC | $647.2 | 66 | 100% | 59.4 | BULL |
| 5 | SIMO | $316.64 | 65 | 100% | 62.8 | BULL |
| 6 | MS | $222.55 | 64 | 100% | 64.0 | BULL |
| 7 | ESI | $46.55 | 64 | 100% | 59.6 | BULL |
| 8 | AXIN | $10.35 | 64 | 83% | 55.6 | BEAR |
| 9 | VSH | $55.54 | 64 | 83% | 52.7 | BEAR |
| 10 | IFS | $55.17 | 64 | 100% | 60.0 | BULL |
#1: TSM — Taiwan Semiconductor Manufacturing
TSM registers an OpportunityRadar score of 76, underpinned by a technical score of 64 and a fundamental score of 95. The current RSI of 54.9 and a BULL MACD signal support the 83% confidence rating for this entry.
Investors should note the risk/reward ratio of 0.8, which reflects the current balance between the potential upside and the defined risk parameters for this position.
#2: GS — Goldman Sachs Group, Inc.
GS presents a strong technical profile with an RSI of 61.1 and a BULL MACD signal. With a 100% confidence rating, the stock shows a 1-month return of 9.17% and a 3-month return of 28.97%.
A primary consideration for this ticker is the risk/reward ratio of 0.4, which is among the more conservative profiles in this data set.
#3: NBIS — Nebius Group N.V.
NBIS demonstrates significant momentum, evidenced by a 1-month return of 24.91% and a 3-month return of 125.81%. The technical indicators include an RSI of 58.0 and a BULL MACD signal.
The 1.5 risk/reward ratio provides a distinct profile compared to other financial-linked assets, suggesting higher potential volatility relative to the identified entry.
#4: WDC — Western Digital Corporation
WDC shows a 100% confidence rating supported by a BULL MACD signal and an RSI of 59.4. Its 3-month return of 118.55% highlights a strong performance trajectory.
The risk/reward ratio for WDC is 2.0, indicating a higher potential for upside relative to the calculated risk, which may be a focal point for active traders.
#5: SIMO — Silicon Motion Technology Corp
SIMO reports an RSI of 62.8 and a BULL MACD signal, contributing to its 100% confidence rating. The stock has experienced substantial growth, with a 3-month return of 185.44%.
With a risk/reward ratio of 1.2, SIMO maintains a balanced profile despite its significant recent performance gains.
#6: MS — Morgan Stanley
MS displays an RSI of 64.0 and a BULL MACD signal, reflecting its current technical standing. The 100% confidence rating is supported by a 3-month return of 34.35%.
Investors should monitor the 0.4 risk/reward ratio, which suggests a tighter margin between the current price of $222.55 and the associated risk levels.
#7: ESI — Element Solutions Inc.
ESI maintains a 100% confidence rating with an RSI of 59.6 and a BULL MACD signal. The stock has delivered a 3-month return of 32.06%.
The risk/reward ratio for ESI stands at 0.6, which is consistent with the moderate risk profiles observed in several other tickers on this list.
#8: AXIN — Axiom Intelligence Acquisition
AXIN carries an 83% confidence rating. While it shows an RSI of 55.6, the MACD is currently in BEAR territory, distinguishing it from the majority of the group.
The risk/reward ratio of 2.0 indicates a higher potential upside, though the BEAR MACD signal warrants careful technical observation.
#9: VSH — Vishay Intertechnology, Inc.
VSH shows an RSI of 52.7 and a BEAR MACD signal. Despite this, it maintains an 83% confidence rating and has achieved a 3-month return of 203.66%.
The risk/reward ratio is 2.0, reflecting the significant movement observed in the stock over the last quarter.
#10: IFS — Intercorp Financial Services I
IFS registers a 100% confidence rating with an RSI of 60.0 and a BULL MACD signal. The stock has posted a 3-month return of 14.3%.
The risk/reward ratio of 0.5 highlights the conservative nature of this position relative to the broader list of tickers analyzed.
Key Observations Across the Scan
Of the 10 tickers profiled, 80% carry a 100% confidence rating. The average RSI for these ten assets is 59.9, suggesting a generally healthy technical environment. Eight of the ten tickers currently display a BULL MACD signal, while two, AXIN and VSH, show BEAR MACD signals despite their BUY status. Notably, three tickers—WDC, VSH, and VECO—feature a risk/reward ratio of 2.0, the highest in this group.
Key Risk Factors
1. MACD Divergence: AXIN and VSH both present BEAR MACD signals despite being flagged for a BUY, which may indicate technical weakness despite the overall score. 2. Low Risk/Reward Ratios: GS, MS, and IFS exhibit risk/reward ratios of 0.4 to 0.5, suggesting limited upside relative to their defined risk parameters. 3. Performance Volatility: The extreme 3-month returns in tickers like VSH (203.66%) and SIMO (185.44%) represent significant price movement that could lead to increased volatility.
About Our Methodology
OpportunityRadar scans 6,600+ US stocks daily using 15+ technical indicators including RSI, MACD, Bollinger Bands, ADX, Aroon, support/resistance levels, and volume analysis, combined with fundamental metrics. Stocks are scored 0-100 with signals ranging from Accumulate to Strong Buy. Entry confidence is rated 50-100% based on 6 confirmation factors.
Disclaimer: This article is for informational purposes only and does not constitute financial advice. Past performance does not guarantee future results. Always conduct your own research and consult a qualified financial advisor before making investment decisions. Data as of June 24, 2026.
Related Articles
Disclaimer : The above information is for general informational purposes only. All information on the Site is provided in good faith, however we make no representation or warranty of any kind, express or implied, regarding the accuracy, adequacy, validity, reliability, availability or completeness of any information on the Site.