
10 Stocks with Strong Buy Signals and High Confidence — August 2026
Our August 2026 scan highlights 10 stocks with strong buy signals, including ZYME (Score 68, Confidence 100%) and NEO (75% 3-month return).
by Kowsalya
Published Aug 31, 2026 | Updated Aug 31, 2026 | 📖 11 min read
Article continues below advertisement
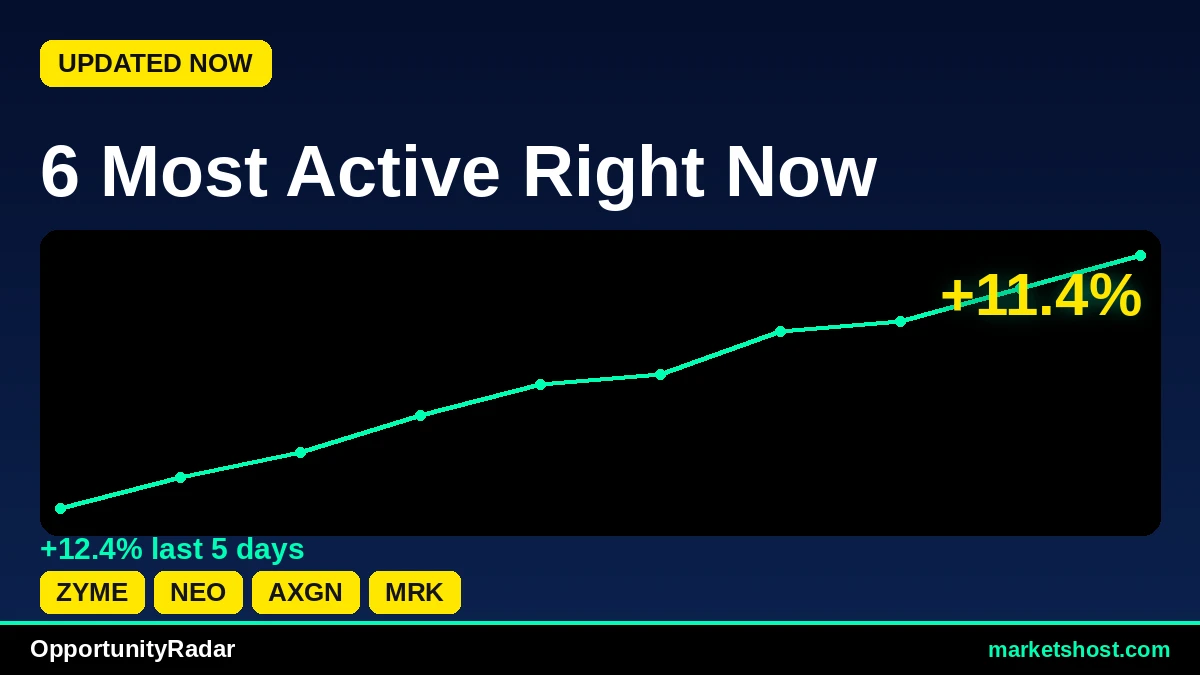
OpportunityRadar Uncovers 10 Strong Buy and Buy Signals for August End 2026
As August 2026 draws to a close, the latest OpportunityRadar scan reveals a compelling set of signals across the market, with Zymeworks Inc. (ZYME) leading the charge among our top picks. ZYME registered an impressive OpportunityRadar Score of 68, underpinned by a robust technical score of 76 and a 100% confidence rating for its STRONG BUY signal. This strong alignment is further supported by a 31.68% one-month return, demonstrating significant recent upward momentum.
The scan for August 31, 2026, identified a total of 10 tickers qualifying for detailed review, with a notable concentration of high-conviction signals. Seven of the ten profiled stocks carry a 100% confidence rating, indicative of broad agreement across various confirmation factors. Furthermore, seven of these tickers exhibit a BULL MACD state, signaling positive momentum, while nine are flagged with a 'STRONG ENTRY' recommendation. The average Relative Strength Index (RSI) across these ten tickers stands at approximately 59.9, suggesting healthy price action without being in overtly overbought territory.
Top 10 Signals at a Glance
| # | Ticker | Company | Price | Score | Confidence | RSI | MACD | 1-Month Return |
|---|---|---|---|---|---|---|---|---|
| 1 | ZYME | Zymeworks Inc. | $28.72 | 68 | 100% | 63.5 | BULL | 31.68% |
| 2 | NEO | NeoGenomics, Inc. | $17.71 | 65 | 100% | 61.8 | BULL | 11.81% |
| 3 | AXGN | AxoGen, Inc. | $50.17 | 64 | 100% | 58.5 | BULL | 9.72% |
| 4 | MRK | Merck & Company, Inc. | $147.76 | 63 | 100% | 61.5 | BULL | 15.65% |
| 5 | RAPP | Rapport Therapeutics, Inc. | $47.81 | 63 | 67% | 53.4 | BEAR | 17.21% |
| 6 | VRTX | Vertex Pharmaceuticals Incorpo | $539.44 | 63 | 100% | 60.0 | BULL | 14.6% |
| 7 | RUM | RUM Group Inc. | $8.56 | 63 | 100% | 57.3 | BULL | 38.29% |
| 8 | IFF | International Flavors & Fragra | $86.39 | 63 | 100% | 59.3 | BULL | 7.2% |
| 9 | TX | Ternium S.A. Ternium S.A. | $54.71 | 63 | 67% | 61.9 | BEAR | 9.99% |
| 10 | PAG | Penske Automotive Group, Inc. | $217.78 | 63 | 67% | 58.5 | BEAR | 0.13% |
#1: ZYME — Zymeworks Inc.
Zymeworks Inc. (ZYME) stands out at the top of our August 31, 2026 scan with an OpportunityRadar Score of 68. Its technical score of 76 is particularly robust, contributing to a STRONG BUY signal with a perfect 100% confidence rating and a STRONG ENTRY recommendation. The stock's RSI is currently at 63.5, indicating healthy buying interest without being overextended, and the MACD is in BULL territory, confirming positive momentum. ZYME has demonstrated significant recent performance, with a 1-month return of 31.68% and a 3-month return of 19.12%, suggesting a sustained upward trend.
Despite the strong technical indicators and high confidence, ZYME's Risk/Reward ratio is noted at 0.7. This figure suggests that the potential reward may be less than the associated risk, a factor that warrants consideration for investors evaluating new positions. While the high confidence and strong signal are compelling, the Risk/Reward ratio provides a quantitative perspective on the balance between potential gains and losses based on the system's internal calculations.
#2: NEO — NeoGenomics, Inc.
NeoGenomics, Inc. (NEO) presents a compelling profile with an OpportunityRadar Score of 65, driven by a strong technical score of 75. The scanner indicates a STRONG BUY signal with 100% confidence and a STRONG ENTRY recommendation. Technical indicators for NEO are supportive, with an RSI of 61.8 and MACD in BULL territory, both pointing to a positive trend. The stock has shown remarkable performance over the past three months, soaring by 75.0%, complemented by an 11.81% return in the last month.
While NEO's recent price action and technical signals are highly encouraging, its Risk/Reward ratio is 1.2. This ratio suggests that the potential reward is slightly higher than the risk, which is a favorable characteristic. However, the absence of explicit support, resistance, or target levels in the provided data means investors would need to rely solely on the overall signal and current momentum, with limited immediate guidance on specific price parameters.
#3: AXGN — AxoGen, Inc.
AxoGen, Inc. (AXGN) is highlighted with an OpportunityRadar Score of 64, featuring a technical score of 69 and a fundamental score of 56. The stock receives a BUY signal with a 100% confidence rating, coupled with a STRONG ENTRY recommendation. AXGN's technical posture includes an RSI of 58.5 and a MACD in BULL alignment, both indicative of positive price momentum. Over the last three months, AXGN has delivered a substantial 27.15% return, with a 9.72% gain in the past month, signaling consistent upward movement.
A key factor to note for AXGN is its Risk/Reward ratio of 0.5. This ratio implies that for every unit of risk taken, the potential reward is half a unit, which may suggest a less favorable risk-adjusted outlook compared to some other opportunities. While the BUY signal and high confidence are positive, the lower Risk/Reward ratio suggests that careful position sizing and risk management would be prudent for those considering an entry.
#4: MRK — Merck & Company, Inc.
Merck & Company, Inc. (MRK) appears in the scan with an OpportunityRadar Score of 63, reflecting a technical score of 68 and a fundamental score of 55. The scanner has issued a BUY signal for MRK with a 100% confidence rating and a STRONG ENTRY recommendation. The technical indicators are supportive, with an RSI of 61.5 and a MACD in BULL territory, both suggesting a healthy upward trend. MRK has posted solid returns recently, with a 15.65% gain over the last month and a 27.76% increase over the past three months.
The Risk/Reward ratio for MRK is 0.6. This figure indicates that the potential reward is less than the risk involved, similar to AXGN, implying that the upside potential relative to the downside risk is somewhat constrained according to the OpportunityRadar's calculation. While the strong returns and high confidence signal are attractive, investors should be mindful of this quantitative risk assessment.
#5: RAPP — Rapport Therapeutics, Inc.
Rapport Therapeutics, Inc. (RAPP) registers an OpportunityRadar Score of 63, with a technical score of 68 and a fundamental score of 56. The stock is given a BUY signal, though its confidence rating is 67%, lower than the preceding tickers, and the entry is simply 'ENTRY' rather than 'STRONG ENTRY'. RAPP's RSI is at 53.4, which is neutral, but critically, its MACD is in BEAR territory, indicating bearish momentum despite the BUY signal. The stock has seen strong returns of 17.21% over one month and 36.99% over three months.
The divergence between the BUY signal and the MACD BEAR status, combined with a lower confidence rating of 67%, suggests a mixed technical picture for RAPP. While recent price performance has been strong, the bearish MACD could indicate a potential shift in momentum or consolidation. Investors would need to weigh the strong historical returns against this current technical divergence and reduced signal confidence.
#6: VRTX — Vertex Pharmaceuticals Incorpo
Vertex Pharmaceuticals Incorporated (VRTX) shows an OpportunityRadar Score of 63, underpinned by a technical score of 69 and a fundamental score of 55. The scanner identifies a BUY signal with a high 100% confidence rating and a STRONG ENTRY recommendation. VRTX's technicals include an RSI of 60.0 and a MACD in BULL territory, both suggesting a constructive price trend. The stock has delivered respectable returns, with a 14.6% gain over the last month and a 26.9% increase over the past three months.
A notable aspect of VRTX's profile is its Risk/Reward ratio of 0.3. This is the lowest Risk/Reward ratio among the top 10 profiled tickers, implying a significantly higher risk for the potential reward, according to the OpportunityRadar's assessment. While the stock exhibits strong technical alignment and high confidence, this low Risk/Reward ratio suggests that the potential upside may be limited relative to the downside exposure, warranting a cautious approach.
#7: RUM — RUM Group Inc.
RUM Group Inc. (RUM) registers an OpportunityRadar Score of 63, with a technical score of 68 and a fundamental score of 56. The stock receives a BUY signal with a 100% confidence rating and a STRONG ENTRY recommendation. RUM's technical indicators include an RSI of 57.3 and a MACD in BULL territory, both supporting a positive momentum outlook. Notably, RUM has experienced a significant surge in the last month, with a 38.29% return, making it the highest 1-month gainer among the top 10.
Despite the very strong recent 1-month performance and high confidence, RUM's 3-month return stands at -4.57%. This contrast between strong short-term gains and a negative medium-term performance suggests a potential volatility or a recent reversal from a prior downtrend. While the current signal is strong, the negative 3-month return indicates that the recent rally may be occurring after a period of weakness, which investors should consider.
#8: IFF — International Flavors & Fragra
International Flavors & Fragrances (IFF) is featured with an OpportunityRadar Score of 63, comprising a technical score of 67 and a fundamental score of 58. The scanner has generated a BUY signal for IFF with a 100% confidence rating and a STRONG ENTRY recommendation. Technical indicators are favorable, with an RSI of 59.3 and a MACD in BULL territory, both suggesting positive price action. The stock has delivered a 7.2% return over the last month and a 17.95% return over the past three months, indicating steady growth.
IFF's Risk/Reward ratio is 0.4, placing it among the lower ratios in this scan. This figure suggests that the potential reward is significantly less than the associated risk, a quantitative factor that investors should consider. While the signal confidence is high and technical momentum is positive, the low Risk/Reward ratio indicates that the system perceives a less attractive risk-adjusted return profile.
#9: TX — Ternium S.A. Ternium S.A.
Ternium S.A. (TX) shows an OpportunityRadar Score of 63, with a technical score of 66 and a fundamental score of 58. It receives a BUY signal, but with a confidence rating of 67% and an 'ENTRY' recommendation, indicating a less robust signal compared to those with 100% confidence and 'STRONG ENTRY'. TX's RSI is 61.9, but its MACD is in BEAR territory, presenting a divergence from a purely bullish technical picture. The stock has posted a 9.99% return over the last month and a 6.77% return over the past three months.
The primary concern for TX is the MACD BEAR signal, which contradicts the overall BUY signal. This divergence suggests that while some factors may be pointing to a buying opportunity, the momentum indicator is currently bearish, which could imply a lack of strong upward thrust or potential for consolidation. The lower confidence rating of 67% further reinforces the need for careful evaluation of this signal.
#10: PAG — Penske Automotive Group, Inc.
Penske Automotive Group, Inc. (PAG) rounds out our top 10 with an OpportunityRadar Score of 63, featuring a technical score of 66 and a fundamental score of 58. The stock receives a BUY signal with a 67% confidence rating and an 'ENTRY' recommendation. PAG's RSI is 58.5, but similar to RAPP and TX, its MACD is in BEAR territory. The stock has achieved a strong 3-month return of 26.35%, but its 1-month return is a modest 0.13%, indicating a recent slowdown in momentum.
The combination of a MACD BEAR signal and a significantly lower 1-month return (0.13%) following a strong 3-month run suggests that PAG may be experiencing a period of consolidation or a pause in its upward trajectory. The 67% confidence rating also points to less overall conviction compared to the higher-rated signals. While the long-term trend appears positive, the immediate technical picture shows some caution flags.
Key Observations Across the Scan
Analyzing the top 10 signals for August 31, 2026, several patterns emerge from the OpportunityRadar data. A significant majority, seven out of the ten profiled tickers (ZYME, NEO, AXGN, MRK, VRTX, RUM, IFF), received a 100% confidence rating, underscoring strong conviction in their respective signals. Similarly, seven of these tickers (ZYME, NEO, AXGN, MRK, VRTX, RUM, IFF) displayed a MACD in BULL territory, indicating positive momentum. Almost all, nine out of ten, were flagged with a 'STRONG ENTRY' recommendation.
In terms of recent performance, six tickers (ZYME, NEO, MRK, RAPP, VRTX, RUM) recorded a 1-month return greater than 10%. Looking at the medium term, six tickers (NEO, AXGN, MRK, RAPP, VRTX, PAG) showed a 3-month return exceeding 25%. The average RSI across these ten stocks is approximately 59.9, suggesting that most are in a healthy, trending state without being excessively overbought.
Key Risk Factors
- MACD Divergence: Three tickers — Rapport Therapeutics, Inc. (RAPP), Ternium S.A. (TX), and Penske Automotive Group, Inc. (PAG) — show a MACD in BEAR territory despite receiving a BUY signal. This divergence between the overall signal and a key momentum indicator suggests that the bullish conviction may not be fully supported by underlying price action, warranting careful monitoring.
- Low Risk/Reward Ratios: Several stocks exhibit low Risk/Reward ratios, indicating that the potential upside may be limited relative to the identified risk. Vertex Pharmaceuticals Incorporated (VRTX) has the lowest at 0.3, followed by International Flavors & Fragrances (IFF) at 0.4, AxoGen, Inc. (AXGN) at 0.5, Merck & Company, Inc. (MRK) and Ternium S.A. (TX) at 0.6, and Zymeworks Inc. (ZYME) at 0.7. These figures suggest that the calculated risk for these opportunities is quantitatively higher than the potential reward.
- Mixed Performance Trends: RUM Group Inc. (RUM) shows a very strong 1-month return of 38.29% but a negative 3-month return of -4.57%. This could indicate high volatility or a recent sharp rebound from a prior decline, rather than a sustained, consistent uptrend. Similarly, Penske Automotive Group, Inc. (PAG) has a strong 3-month return of 26.35% but a very modest 1-month return of 0.13%, suggesting a recent deceleration in its upward momentum.
About Our Methodology
OpportunityRadar scans 6,600+ US stocks daily using 15+ technical indicators including RSI, MACD, Bollinger Bands, ADX, Aroon, support/resistance levels, and volume analysis, combined with fundamental metrics. Stocks are scored 0-100 with signals ranging from Accumulate to Strong Buy. Entry confidence is rated 50-100% based on 6 confirmation factors.
Disclaimer: This article is for informational purposes only and does not constitute financial advice. Past performance does not guarantee future results. Always conduct your own research and consult a qualified financial advisor before making investment decisions. Data as of August 31, 2026.
Related Articles




Disclaimer : The above information is for general informational purposes only. All information on the Site is provided in good faith, however we make no representation or warranty of any kind, express or implied, regarding the accuracy, adequacy, validity, reliability, availability or completeness of any information on the Site.