
Top Bullish Stocks Today: KRO, ECL, J, AWR & RNW Lead Scanner
KRO, ECL, J, AWR, ARTNA and RNW lead today’s stock scanner with strong bullish signals. Check top stocks, targets, entry zones, risk/reward and bearish stocks to avoid.
by Kowsalya
Published Aug 27, 2026 | Updated Aug 27, 2026 | 📖 10 min read
Article continues below advertisement
On This Page
- Stock Scanner Today: Key Takeaways
- Top Bullish Stocks to Watch Today
- Which Stock Has the Strongest Bullish Signal Today?
- ECL Remains One of the Strongest Large-Cap Momentum Setups
- J Shows Powerful Trend Strength, But RSI Reaches 70
- AWR Shows Strong Trend Continuation Setup
- ARTNA May Be One of the More Interesting Near-Zone Setups
- RNW Continues to Show Strong Momentum
- SUM Is Bullish but Now Overbought
- Stocks Closest to Their Calculated Entry Zones
- FLUX Gets an 88% Strong Entry Signal - But There Is a Major Warning
- Breakout Stocks Showing Volume Confirmation
- Stocks Showing Bullish MACD Momentum
- Golden Cross Stocks in the Scanner
- Stocks to Avoid Based on the Scanner
- Which Stocks Have an "Exit Now" Signal?
- DY Shows One of the Weakest Technical Profiles
- Best Momentum Stocks vs Best Entry Setups
- Why Risk/Reward Is the Biggest Limitation in Today's Scanner
- What Are the Best Stocks to Watch From This Scan?
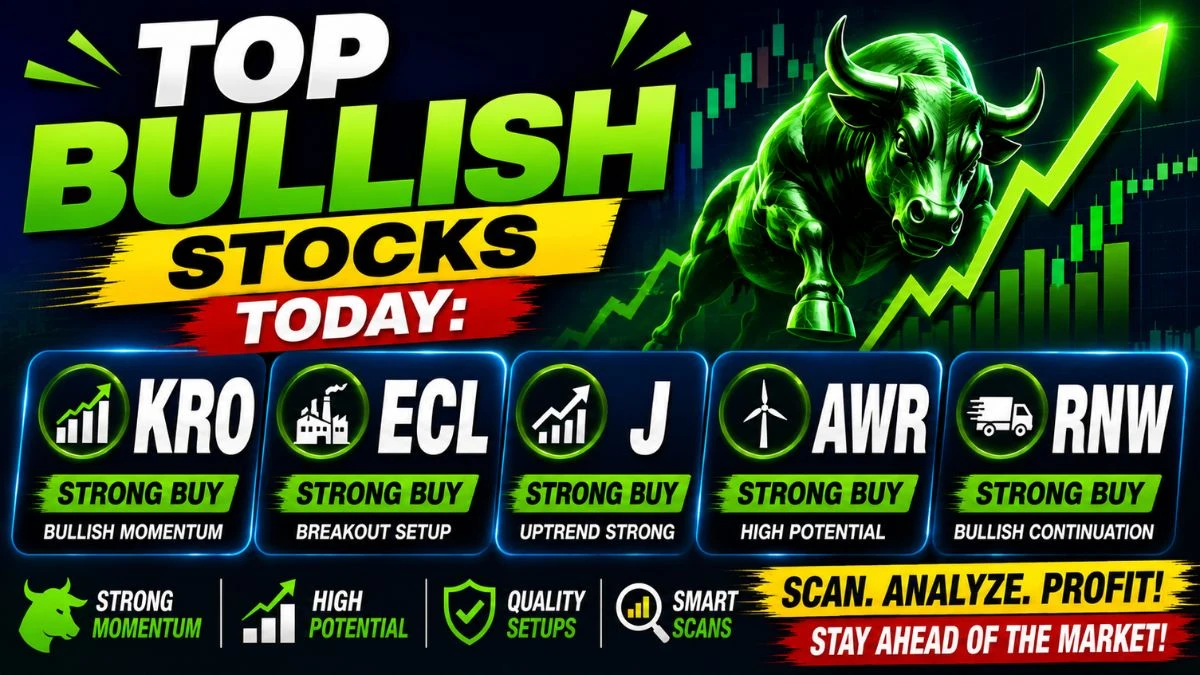
The latest Marketshost stock scanner is showing strong bullish momentum in KRO, ECL, J, AWR, ARTNA and RNW, with several names scoring near the top of the technical ranking system. KRO leads the entire scan with a score of 14, followed by ECL and J with scores of 13, while AWR, ARTNA and RNW each score 12.
However, there is an important catch for traders: many of the strongest stocks have already moved above their calculated entry zones, while the scanner's projected risk-to-reward ratio for most setups is only around 1.3:1. That means the strongest momentum stocks may be better treated as stocks to watch or manage, rather than stocks to chase at any price.
At the opposite end of the scanner, DY, GWH, OLN, AGX and SMID remain among the weakest names, with deeply negative scores and bearish trend readings.
Stock Scanner Today: Key Takeaways
- KRO is the No. 1 ranked stock with a scanner score of 14.
- ECL and J rank next with scores of 13.
- AWR, ARTNA and RNW each carry a score of 12 and 77% scanner confidence.
- FLUX has the highest entry confidence at 88%, but its calculated risk/reward is only 0.2:1.
- SUM is overbought, with RSI at 70.5, and the scanner has shifted its exit signal to "Take Profit."
- J is also at RSI 70, suggesting the stock is becoming stretched after its recent advance.
- KRO, ECL, J, AWR, RNW and GDRX are already above their calculated entry zones.
- OLN, AGX, HUN, BLDP and RUN have explicit "Exit Now" signals in the scanner.
- Several rows containing #REF! errors have been excluded from this analysis.
Top Bullish Stocks to Watch Today
| Stock | Price | Scanner Score | Rank | Confidence | Trend | Entry Type | Target 1 |
|---|---|---|---|---|---|---|---|
| KRO | $8.79 | 14 | 1 | 77% | Trending | Trend Continuation | $9.78 |
| ECL | $290.60 | 13 | 2 | 62% | Weak | Breakout | $302.25 |
| J | $151.52 | 13 | 2 | 77% | Trending | Trend Continuation | $158.53 |
| AWR | $89.83 | 12 | 4 | 77% | Trending | Trend Continuation | $93.32 |
| ARTNA | $35.42 | 12 | 4 | 77% | Trending | Trend Continuation | $36.84 |
| RNW | $6.82 | 12 | 4 | 77% | Trending | Trend Continuation | $7.04 |
| SUM | $1.53 | 11 | 7 | 77% | Trending | Trend Continuation | $1.63 |
| CWST | $93.74 | 11 | 7 | 47% | Ranging | Breakout | $99.20 |
| RSG | $222.18 | 10 | 9 | 47% | Ranging | Breakout | $230.37 |
| FLUX | $0.66 | 9 | 10 | 88% | Trending | Trend Continuation | $0.69 |
Which Stock Has the Strongest Bullish Signal Today?
KRO currently has the strongest overall scanner reading.
KRO is trading at $8.79 with a scanner score of 14, making it the No. 1 ranked stock in the latest scan. Its RSI stands at 65.5, MACD is bullish, ADX is 26.3, and positive directional movement is significantly stronger than negative directional movement.
The stock has also gained approximately:
- 7.99% in one week
- 42.00% in one month
- 20.91% in three months
KRO's first calculated upside target is $9.78, followed by $10.28 and $11.62.
There is one important issue: the scanner's preferred entry zone was $5.79-$7.82, meaning the current price of $8.79 is already well above the suggested accumulation area.
The scanner therefore shows "Tighten Stop", rather than suggesting traders aggressively chase the move. Its calculated stop loss is $8.05.
KRO Technical Snapshot
| Indicator | Reading |
|---|---|
| Price | $8.79 |
| Score | 14 |
| Rank | 1 |
| RSI | 65.5 |
| ADX | 26.3 |
| MACD | Bullish |
| DI Signal | Bullish |
| Confidence | 77% |
| Entry Type | Trend Continuation |
| Entry Zone | $5.79-$7.82 |
| Target 1 | $9.78 |
| Target 2 | $10.28 |
| Target 3 | $11.62 |
| Stop Loss | $8.05 |
ECL Remains One of the Strongest Large-Cap Momentum Setups
ECL ranks second in the scan with a score of 13.
The stock is trading at $290.60, above both its 50-day SMA of $277.47 and 200-day SMA of $272.06. RSI is 63.7, MACD is bullish and +DI at 33.9 is comfortably above -DI at 13.7.
ECL has also posted:
- 1-week return: +1.74%
- 1-month return: +2.72%
- 3-month return: +10.67%
The scanner identifies the setup as a breakout, with 62% confidence.
Its calculated targets are:
- $302.25
- $308.07
- $308.35
However, ECL is already above its calculated $273.54-$282.26 entry zone, so the scanner has moved to a tighten-stop stance.
J Shows Powerful Trend Strength, But RSI Reaches 70
J is another major bullish leader, scoring 13 with 77% confidence.
The stock is trading at $151.52, while its RSI has reached 70.0. Its ADX reading of 47.0 is one of the strongest trend readings among the leading names in the scanner.
Other bullish readings include:
- MACD: Bullish
- +DI: 35.5
- -DI: 8.0
- OBV trend: Rising
- 1-month return: +7.76%
- 3-month return: +30.73%
Its first target stands at $158.53, followed by $162.04 and $181.63.
But momentum traders should notice that J is already above its calculated entry zone of $134.85-$144.88, while RSI is now around the traditional overbought threshold.
The scanner's current instruction is therefore "Tighten Stop."
AWR Shows Strong Trend Continuation Setup
AWR carries a score of 12, 77% confidence and a strong trend reading.
At $89.83, AWR remains well above its:
- 50-day SMA: $85.35
- 200-day SMA: $77.46
Its ADX stands at 38.1, while +DI at 29.2 is substantially above -DI at 11.3.
The stock has gained 16.94% over three months, while remaining just 1.39% below its recent high according to the scanner.
Calculated targets are:
- Target 1: $93.32
- Target 2: $95.06
- Target 3: $102.81
The scanner's stop-loss level is $87.21.
Like several other leaders, however, AWR has moved above its calculated $83.98-$87.73 entry zone.
ARTNA May Be One of the More Interesting Near-Zone Setups
ARTNA deserves attention because its price remains relatively close to its calculated entry area compared with several other top-ranked stocks.
ARTNA is trading at $35.42, while the scanner's preferred zone is $33.73-$35.00.
The stock has:
- Scanner score: 12
- Confidence: 77%
- RSI: 57.1
- ADX: 27.4
- MACD: Bullish
- DI signal: Bullish
- 3-month return: +9.39%
Its first upside target is $36.84, with additional targets at $37.54 and $38.75.
Unlike some heavily extended momentum stocks, ARTNA's RSI is still below 60, making it less technically stretched than KRO or J.
RNW Continues to Show Strong Momentum
RNW is trading at $6.82 with a scanner score of 12 and 77% confidence.
The stock's technical profile includes:
- RSI: 65.8
- MACD: Bullish
- ADX: 28.7
- +DI: 27.9
- -DI: 12.0
- OBV trend: Rising
- 1-month return: +11.99%
- 3-month return: +10.53%
The calculated first target is $7.04, followed by $7.15 and $7.61.
RNW has also moved above its calculated $5.95-$6.57 entry zone, and the scanner recommends tightening the stop.
SUM Is Bullish but Now Overbought
SUM is one of the clearest examples of why a Strong Buy scanner score does not automatically mean a fresh buy at the current price.
SUM scores 11 with 77% confidence, but RSI has reached 70.5 and stochastic %K is an extremely high 94.4.
MFI is also overbought at 82.6.
The scanner therefore generates a:
Exit Signal: TAKE PROFIT
SUM is trading at $1.53, compared with an entry zone of $1.28-$1.41.
Its first target is only $1.63.
The underlying trend remains bullish, but the current technical setup suggests momentum has become stretched.
Stocks Closest to Their Calculated Entry Zones
Some of the highest-ranked stocks have already run significantly above their entry areas. Traders looking for stocks that have not moved as far away from scanner zones may therefore want to monitor names closer to their calculated ranges.
| Stock | Price | Entry Zone | Score | Confidence |
|---|---|---|---|---|
| ARTNA | $35.42 | $33.73-$35.00 | 12 | 77% |
| CWT | $50.26 | $49.20-$50.04 | 7 | 35% |
| PHO | $72.15 | $70.11-$72.01 | 4 | 62% |
| CGW | $65.74 | $64.31-$65.61 | 6 | 47% |
| TTEK | $36.59 | $32.90-$35.47 | 7 | 65% |
| USLM | $118.09 | $111.70-$117.59 | 3 | 77% |
These stocks are not necessarily stronger than KRO, J or ECL. They are simply closer to the price zones calculated by the scanner.
FLUX Gets an 88% Strong Entry Signal - But There Is a Major Warning
FLUX stands out because it is the only stock in this scan carrying a "Strong Entry" designation with 5 of 6 conditions met and 88% confidence.
Technically, FLUX shows:
- Price: $0.66
- RSI: 50.6
- MACD: Bullish
- ADX: 33.9
- +DI: 23.0
- -DI: 11.4
- OBV trend: Rising
- Scanner score: 9
However, the calculated risk/reward is only 0.2:1.
Its entry zone is $0.44-$0.61, meaning the stock is also trading above the preferred scanner range.
The first target of $0.69 is only slightly above the current price.
This makes FLUX a useful reminder that confidence percentage alone should never be used to rank trade quality. Entry price, stop-loss distance and potential reward matter as well.
Breakout Stocks Showing Volume Confirmation
Several stocks received the scanner's "Volume confirms - high conviction" action message.
Notable names include:
- ECL
- RSG
- CWST
- CWT
- GDRX
- PHO
- CGW
- APD
- J
- RNW
- FLUX
- BE
- ENPH
Volume confirmation can strengthen a technical move because rising participation generally makes a breakout or trend more meaningful than a move occurring on weak trading activity.
Still, volume confirmation should be evaluated alongside price location and risk/reward.
Stocks Showing Bullish MACD Momentum
MACD is currently bullish in several notable scanner leaders, including:
KRO, ECL, J, AWR, ARTNA, RNW, RSG, CWST, AWK, WTRG, GDRX, CE, GEVO, ASTE, CX, BE, PLUG and RUN.
A bullish MACD reading indicates improving short-term momentum, but it does not automatically override a weak primary trend.
RUN is a good example: MACD is bullish, yet the stock still carries a scanner score of -8, remains in a broader bearish configuration and has an Exit Now signal.
Golden Cross Stocks in the Scanner
Several bullish leaders also show a Golden Cross, where the shorter-term moving average is above the longer-term average.
Notable names include:
- KRO
- ECL
- J
- AWR
- ARTNA
- RSG
- CWST
- GDRX
- PHO
- CGW
A Golden Cross can support an intermediate or long-term bullish trend, but traders should still pay attention to whether the stock is already extended significantly above its moving averages.
Stocks to Avoid Based on the Scanner
The bearish side of the scanner remains equally important.
Weakest Scanner Scores
| Stock | Price | Score | Trend | Signal | Scanner Action |
|---|---|---|---|---|---|
| DY | $310.91 | -12 | Weak | Strong Sell | Avoid |
| GWH | $0.38 | -12 | Weak | Strong Sell | Avoid |
| OLN | $17.52 | -11 | Trending | Strong Sell | Avoid |
| AGX | $455.15 | -11 | Trending | Strong Sell | Avoid |
| SMID | $25.61 | -11 | Ranging | Strong Sell | Avoid |
| TROX | $5.47 | -10 | Weak | Strong Sell | Avoid |
| ORGN | $0.06 | -10 | Weak | Strong Sell | Avoid |
| HUN | $9.63 | -9 | Trending | Strong Sell | Avoid |
| XYL | $113.42 | -9 | Weak | Strong Sell | Avoid |
| BLDP | $2.29 | -9 | Trending | Strong Sell | Avoid |
Which Stocks Have an "Exit Now" Signal?
Five notable stocks have especially bearish scanner exit signals:
OLN
OLN carries a score of -11, with ADX at 32.8, suggesting the bearish trend has meaningful strength.
The stock is down approximately:
- 6.36% in one week
- 18.02% in one month
- 32.67% in three months
Scanner signal: EXIT NOW
AGX
AGX has a score of -11, RSI of 30.6 and ADX of 29.6.
The stock is down:
- 13.80% in one week
- 12.92% in one month
- 32.42% in three months
Scanner signal: EXIT NOW
HUN
HUN is down more than 35% over three months and has ADX at 27.8, with -DI far above +DI.
Scanner signal: EXIT NOW
BLDP
BLDP carries a score of -9 and has declined approximately 62.4% over three months.
Scanner signal: EXIT NOW
RUN
RUN remains in a technically weak longer-term trend despite a bullish MACD reading.
It is down approximately:
- 6.84% in one week
- 39.93% in three months
- 57.36% from its recent high
Scanner signal: EXIT NOW
DY Shows One of the Weakest Technical Profiles
DY has the lowest scanner score at -12, tied with GWH.
The stock fell 11.62% in the latest session represented in the scanner, while RSI dropped to 25.1, indicating an oversold condition.
Its recent performance remains deeply negative:
- 1 week: -22.81%
- 1 month: -22.63%
- 3 months: -41.24%
An oversold reading can sometimes lead to short-term rebounds, but oversold does not automatically mean the broader downtrend has ended.
The scanner continues to classify DY as Strong Sell / Avoid.
Best Momentum Stocks vs Best Entry Setups
This distinction is important.
Strongest momentum stocks
Based on score and trend strength, the leading names are:
- KRO
- ECL
- J
- AWR
- ARTNA
- RNW
Highest-confidence scanner setups
Stocks showing 77% or greater entry confidence include:
- FLUX - 88%
- KRO - 77%
- J - 77%
- AWR - 77%
- ARTNA - 77%
- RNW - 77%
- YORW - 77%
- GDRX - 77%
- USLM - 77%
- AQB - 77%
- SUM - 77%
But several of these stocks are already above their suggested entry zones.
Therefore, the strongest scanner score and the best current entry price are not necessarily the same thing.
Why Risk/Reward Is the Biggest Limitation in Today's Scanner
One feature stands out across the scan: a large number of bullish setups have only about 1.3:1 calculated risk/reward.
Examples include:
- KRO - 1.3:1
- ECL - 1.3:1
- J - 1.3:1
- AWR - 1.3:1
- ARTNA - 1.3:1
- RNW - 1.3:1
- RSG - 1.3:1
- CWST - 1.3:1
- GDRX - 1.3:1
- PHO - 1.3:1
- CGW - 1.3:1
Other setups are even weaker.
FLUX, despite its 88% confidence, has only 0.2:1 calculated risk/reward.
ENPH has 0.3:1, BE has 0.7:1, PLUG has 0.6:1, and STEM has only 0.1:1.
This is why a scanner can label a stock Strong Buy based on technical momentum while simultaneously flagging the trade as poor from a risk/reward perspective.
What Are the Best Stocks to Watch From This Scan?
For traders building a short watchlist, the scanner currently points to three different groups.
Strong Trend Leaders
KRO, J, AWR, ARTNA and RNW
These stocks combine high scores, strong directional readings and high confidence.
Breakout Watchlist
ECL, RSG, CWST, AWK, WTRG and TTEK
These stocks have breakout characteristics, although several are already above their preferred entry ranges.
Stocks Closer to Entry Zones
ARTNA, CWT, PHO and CGW
These names remain relatively closer to calculated entry ranges than many of the strongest momentum leaders.
Related Articles




Disclaimer : The above information is for general informational purposes only. All information on the Site is provided in good faith, however we make no representation or warranty of any kind, express or implied, regarding the accuracy, adequacy, validity, reliability, availability or completeness of any information on the Site.