
Stock Scanner Today: SNAP 88% Strong Entry, DIS, MA & NDAQ Top Scores
Stock scanner today highlights SNAP with an 88% Strong Entry signal, while DIS, MA, NDAQ, GRVY and SGHT lead technical scores. Check top buy, hold and avoid stocks.
by Kowsalya
Published Aug 27, 2026 | Updated Sep 04, 2026 | 📖 10 min read
Article continues below advertisement
On This Page
- Stock Scanner Today: Key Signals at a Glance
- Top Strong Buy Stocks From the Scanner
- SNAP Stands Out With an 88% Strong Entry Signal
- SGHT and GRVY Lead the SCORE Rankings
- Disney Shows One of the Strongest Large-Cap Setups
- Mastercard and Nasdaq Look Strong but Overbought
- ROKU Momentum Remains Powerful
- SONY, COIN and HOOD Remain on the Strong Buy List
- Stocks Showing Strong Momentum but Needing a Pullback
- Other Strong Buy Stocks Worth Watching
- Which Stocks Have the Strongest Fresh Entry Signals?
- Risk/Reward Is the Biggest Weakness in This Scan
- Stocks the Scanner Says to Avoid
- What Do SCORE and Confidence Mean?
- Strong Buy Does Not Always Mean Buy Right Now
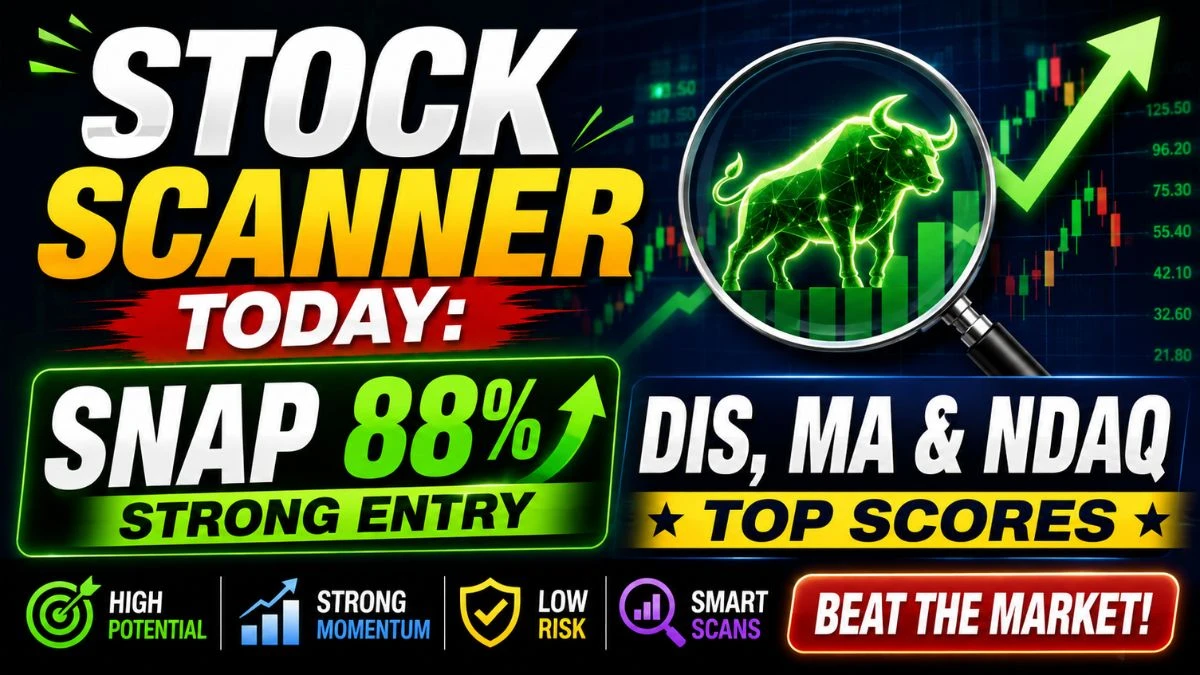
A fresh technical stock scan is showing powerful momentum across selected media, gaming, fintech, payments and technology stocks, with SNAP emerging as the strongest fresh entry signal at 88% confidence.
At the same time, SGHT, GRVY, DIS, MA, VIRT and NDAQ recorded the highest scanner SCORE of 13, while ROKU and GPN followed closely with scores of 12.
There is an important catch for traders, however. Many of the highest-ranked stocks have already moved beyond their preferred entry zones, and several are approaching overbought territory. The scanner therefore favors protecting profits or waiting for pullbacks rather than blindly chasing the strongest performers.
Stock Scanner Today: Key Signals at a Glance
Here are the most important findings from the latest technical scan:
- SNAP: Strongest fresh entry signal with 88% confidence
- SGHT: SCORE 13, strong trend continuation
- GRVY: SCORE 13 with bullish trend and rising volume
- DIS: SCORE 13 and 77% entry confidence
- MA: SCORE 13 but RSI has reached 72, indicating an overbought setup
- VIRT: SCORE 13 with strong momentum and bullish directional indicators
- NDAQ: SCORE 13, although RSI has crossed 70
- ROKU: SCORE 12 and strong uptrend, but currently overbought
- GPN: SCORE 12 with bullish trend confirmation
- SONY: SCORE 11 with positive momentum and volume confirmation
- COIN: SCORE 11 with strong crypto-related momentum
- HOOD: SCORE 11 after strong short- and medium-term gains
- V: SCORE 11 but extended above the preferred entry zone
- ICE: SCORE 11 with RSI above 72
- CME: SCORE 11 and strong trend, but the scanner recommends waiting for a pullback
Top Strong Buy Stocks From the Scanner
| Stock | Price | SCORE | Signal | Confidence | Technical Status |
|---|---|---|---|---|---|
| SGHT | $8.37 | 13 | Strong Buy | 77% | Trend continuation |
| GRVY | $73.46 | 13 | Strong Buy | 77% | Trend continuation |
| DIS | $109.63 | 13 | Strong Buy | 77% | Trend continuation |
| MA | $598.47 | 13 | Strong Buy | 77% | Overbought |
| VIRT | $65.74 | 13 | Strong Buy | 47% | Breakout |
| NDAQ | $99.47 | 13 | Strong Buy | 77% | Overbought |
| ROKU | $158.60 | 12 | Strong Buy | 77% | Overbought |
| GPN | $92.96 | 12 | Strong Buy | 65% | Breakout |
| SNAP | $5.42 | 11 | Strong Buy | 88% | Strong Entry |
| SONY | $24.12 | 11 | Strong Buy | 65% | Breakout |
| COIN | $181.78 | 11 | Strong Buy | 62% | Breakout |
| HOOD | $108.54 | 11 | Strong Buy | 47% | Breakout |
| V | $383.90 | 11 | Strong Buy | 62% | Extended |
| ICE | $161.92 | 11 | Strong Buy | 77% | Overbought |
| CME | $280.98 | 11 | Strong Buy | 77% | Extended |
SNAP Stands Out With an 88% Strong Entry Signal
Snap Inc. (SNAP) produced one of the most interesting signals in the entire scan.
SNAP was trading at $5.42, down 8.45% in the latest session included in the scanner, but its underlying technical indicators remained constructive.
Key SNAP signals include:
- SCORE: 11
- Scanner signal: Strong Buy
- Entry signal: Strong Entry
- Entry type: Trend continuation
- Conditions met: 5 of 6
- Confidence: 88%
- RSI: 54.5
- ADX: 27.5
- +DI: 31.4
- -DI: 14.7
- MACD: Bullish
- OBV trend: Rising
- Entry zone: $4.70-$5.29
- Target 1: $6.03
- Target 2: $6.34
- Target 3: $9.09
- Stop loss: $4.96
The bullish case comes from the combination of improving momentum, positive directional movement and rising volume.
However, SNAP's latest scanner price of $5.42 is already slightly above the preferred entry zone. That makes a pullback toward the breakout area potentially more attractive than chasing the stock higher.
SGHT and GRVY Lead the SCORE Rankings
SGHT
Sightline-related ticker SGHT recorded a SCORE of 13, putting it at the top of the scanner.
The stock showed:
- RSI: 74.5
- ADX: 38.3
- Bullish DI structure
- Rising OBV
- Golden moving-average crossover
- 57.92% one-month return
- 71.87% three-month return
Those numbers confirm extremely strong momentum.
But RSI above 70 also means the stock is technically overbought. The scanner therefore recommends tightening the stop rather than aggressively adding after the rally.
SGHT's preferred entry zone was $4.98-$7.42, compared with a scanner price of $8.37.
GRVY
GRVY also scored 13, supported by:
- RSI of 69.8
- Bullish MACD
- ADX of 29.5
- +DI of 26.4 versus -DI of 9.2
- Rising OBV
- MFI of 86.8
- Golden crossover
- 18.48% one-month return
- 17.25% three-month return
GRVY's technical trend remains strong, but at $73.46 the stock was already above its $59.46-$68.04 preferred entry zone.
The scanner consequently favors risk management over chasing.
Disney Shows One of the Strongest Large-Cap Setups
Walt Disney (DIS) is one of the most notable large-cap stocks in the scan.
Disney received:
- SCORE: 13
- Signal: Strong Buy
- Confidence: 77%
- RSI: 65.2
- ADX: 29.2
- +DI: 36.9
- -DI: 12.9
- OBV: Rising
- One-month return: 10.86%
- Three-month return: 5.23%
The combination of +DI significantly exceeding -DI, rising volume and strong medium-term momentum supports the bullish trend.
Disney's scanner entry zone was $95.31-$104.13, while its latest scanner price was $109.63.
That means the trend remains technically bullish, but the preferred entry has already passed.
The first upside target stands near $114.30, followed by approximately $116.64-$116.65.
Mastercard and Nasdaq Look Strong but Overbought
Two major financial-market names — Mastercard (MA) and Nasdaq (NDAQ) — also achieved the maximum SCORE of 13.
Mastercard
Mastercard showed an exceptionally strong technical structure:
- RSI: 72.0
- MACD: Bullish
- ADX: 37.4
- +DI: 35.7
- -DI: 11.0
- OBV: Rising
- Golden crossover
- One-month return: 6.35%
- Three-month return: 20.89%
But an RSI of 72 places MA in overbought territory.
The scanner's exit signal is therefore Take Profit, despite the underlying Strong Buy rating.
This distinction is important: a stock can remain in a powerful bullish trend while simultaneously becoming less attractive for a new entry after a large advance.
Nasdaq
NDAQ shows a similar pattern.
Its technical profile includes:
- SCORE: 13
- RSI: 70.1
- Stochastic %K: 96.4
- ADX: 28.8
- +DI: 21.7
- -DI: 11.4
- Rising OBV
- Golden crossover
NDAQ remains technically strong, but both RSI and Stochastic indicators indicate stretched short-term momentum.
The scanner consequently gives NDAQ a Take Profit signal.
ROKU Momentum Remains Powerful
ROKU received a SCORE of 12, one of the highest readings in the scan.
The stock showed:
- RSI: 71.9
- ADX: 53.6
- +DI: 40.6
- -DI: 7.5
- Rising OBV
- Golden crossover
- One-month gain: 10.21%
- Three-month gain: 20.23%
An ADX above 50 combined with a large positive DI spread indicates an unusually strong trend.
However, RSI above 70 also confirms that the move has become stretched.
ROKU's scanner therefore shows Take Profit rather than a fresh aggressive entry.
SONY, COIN and HOOD Remain on the Strong Buy List
Several other widely followed stocks are displaying constructive technical setups.
SONY
SONY scored 11 with:
- 65% confidence
- Bullish directional trend
- Rising OBV
- RSI of 62.9
- 10.34% three-month gain
Its first target is $25.10, followed by $25.59.
Coinbase
Coinbase (COIN) scored 11, backed by:
- Bullish MACD
- RSI of 61.1
- Rising OBV
- CCI of 134.4
- ROC of 22.3%
- +DI of 29.4 versus -DI of 13.3
COIN's preferred scanner entry zone, however, was $129.24-$158.44, well below the $181.78 scanner price.
That makes COIN another example of a bullish stock that has already moved substantially away from its ideal entry area.
Robinhood
HOOD also received a SCORE of 11.
Its momentum indicators include:
- RSI: 59.4
- Bullish MACD
- Stochastic %K: 81.4
- Rising OBV
- CCI: 184.8
- ROC: 14.8%
- One-month return: 17.01%
- Three-month return: 42.38%
The technical trend remains positive, although the preferred scanner entry zone of $82.26-$96.18 is below the $108.54 scanner price.
Stocks Showing Strong Momentum but Needing a Pullback
A high technical SCORE does not automatically mean that a stock is at an ideal buying price.
Several names appear extended beyond their preferred entry zones.
These include:
| Stock | Scanner Price | Preferred Entry Zone | Current Scanner View |
|---|---|---|---|
| SGHT | $8.37 | $4.98-$7.42 | Tighten stop |
| GRVY | $73.46 | $59.46-$68.04 | Tighten stop |
| DIS | $109.63 | $95.31-$104.13 | Tighten stop |
| MA | $598.47 | $549.93-$574.25 | Take profit |
| NDAQ | $99.47 | $92.71-$96.22 | Take profit |
| ROKU | $158.60 | $143.02-$153.19 | Take profit |
| COIN | $181.78 | $129.24-$158.44 | Tighten stop |
| HOOD | $108.54 | $82.26-$96.18 | Hold |
| V | $383.90 | Extended | Wait for pullback |
| CME | $280.98 | Extended | Wait for pullback |
For traders searching for new entries, this is one of the most important conclusions from the scan.
The strongest stocks are not necessarily the best stocks to chase at their current prices.
Other Strong Buy Stocks Worth Watching
The scanner also identified a broader group of positive setups.
Notable stocks include:
- WBD — SCORE 10
- DV — SCORE 10
- PYPL — SCORE 10
- MKTX — SCORE 10
- AGS — SCORE 10
- FUBO — SCORE 9
- AMC — SCORE 9
- IMAX — SCORE 9
- ZETA — SCORE 9
- MSTR — SCORE 9
- MARA — SCORE 9
- BTDR — SCORE 9
- CBOE — SCORE 9
- MSFT — SCORE 8
- BTBT — SCORE 8
- U — SCORE 7
- NFLX — SCORE 7
- SE — SCORE 7
- EDR — SCORE 7
- SCHW — SCORE 7
Among these, Microsoft (MSFT) is particularly notable because its ADX stands at 34.6, +DI substantially exceeds -DI, OBV is rising and its three-month scanner return is 20.28%.
However, its RSI has already climbed to 67.4, leading the scanner to recommend tightening the stop.
Which Stocks Have the Strongest Fresh Entry Signals?
Based specifically on the scanner's Entry Signal rather than its overall Strong Buy SCORE, four stocks stand out.
| Stock | Entry Signal | Conditions Met | Confidence |
|---|---|---|---|
| SNAP | Strong Entry | 5/6 | 88% |
| SOS | Strong Entry | 5/6 | 73% |
| META | Strong Entry | 5/6 | 58% |
| RIOT | Strong Entry | 5/6 | 58% |
SNAP therefore has the strongest combination of completed conditions and confidence among the fresh-entry signals in this scan.
That does not necessarily mean it has the best risk/reward profile, however.
Risk/Reward Is the Biggest Weakness in This Scan
Despite numerous Strong Buy signals, one caution appears repeatedly across the scanner:
Risk/reward ratios are generally weak.
Many bullish setups carry an estimated 1.3:1 risk/reward ratio, while some stocks have ratios below 1:1.
Examples include:
- SNAP: 1.3:1
- DIS: 1.3:1
- SGHT: 1.3:1
- GRVY: 1.3:1
- MA: 1.3:1
- ROKU: 1.3:1
- SONY: 1.3:1
- COIN: 1.3:1
- META: 0.5:1
- RIOT: 0.6:1
- MARA: 0.5:1
- RBLX: 0.1:1
This explains why several stocks can simultaneously receive a Strong Buy technical rating and a Hold, Tighten Stop or Take Profit instruction.
The momentum may be bullish, but the potential upside from the current price may no longer sufficiently compensate for downside risk.
Stocks the Scanner Says to Avoid
Several stocks remain in technically weak downtrends.
The strongest bearish readings include:
| Stock | SCORE | Signal | Scanner Action |
|---|---|---|---|
| TTD | -11 | Strong Sell | Avoid / Exit Now |
| PENN | -10 | Strong Sell | Avoid / Exit Now |
| CORZ | -10 | Strong Sell | Avoid / Exit Now |
| BYD | -8 | Strong Sell | Avoid |
| BALY | -8 | Strong Sell | Avoid |
| FIS | -7 | Strong Sell | Avoid |
| OTGLY | -7 | Strong Sell | Avoid |
| DDOG | -6 | Strong Sell | Avoid |
| PLTK | -6 | Strong Sell | Avoid |
| TCEHY | -6 | Strong Sell | Avoid |
| WYNN | -5 | Sell | Wait/Avoid |
| TTWO | -5 | Sell | Avoid |
TTD Has the Weakest Reading
TTD recorded the lowest SCORE in the scan at -11.
Its technical picture includes:
- RSI: 31.1
- Bearish MACD
- ADX: 25.8
- +DI: 16.6
- -DI: 32.5
- Falling OBV
- MFI: 19.4
- One-month return: -31.09%
- Three-month return: -41.54%
The scanner labels the setup a strong downtrend and generates an Exit Now signal.
PENN and CORZ show similarly bearish structures, with ADX confirming established downside trends.
What Do SCORE and Confidence Mean?
The scanner uses multiple technical indicators rather than relying on a single metric.
The analysis includes signals from:
- Relative Strength Index, or RSI
- MACD
- Stochastic oscillator
- Average Directional Index, or ADX
- +DI and -DI
- On-Balance Volume
- Money Flow Index
- Commodity Channel Index
- Rate of Change
- Williams %R
- Aroon indicators
- Bollinger Bands
- Moving-average crossovers
- Historical volatility
- 50-day and 200-day moving averages
- Short- and medium-term price performance
A higher SCORE indicates that more technical factors are aligned bullishly.
However, Confidence % and Entry Signal are equally important, because a stock may have an excellent trend score but already be too extended to provide an attractive new entry.
Strong Buy Does Not Always Mean Buy Right Now
This scanner highlights an important distinction for momentum investors.
A Strong Buy label describes the strength of the underlying technical setup. It does not necessarily mean the stock should be purchased immediately at any price.
For example:
MA, NDAQ and ROKU have some of the strongest technical scores in the entire list but are simultaneously showing Take Profit signals because momentum has become overbought.
Meanwhile, SNAP's overall SCORE is lower at 11, but it produces the strongest fresh-entry reading because five of six entry conditions are satisfied with 88% confidence.
That distinction can help traders separate:
- Stocks already in powerful uptrends
- Stocks approaching fresh entry points
- Stocks that have become overextended
- Stocks where downside trends remain dominant
The latest Marketshost technical scanner remains bullish on several momentum leaders, particularly SGHT, GRVY, DIS, MA, VIRT and NDAQ, which all recorded top SCORE readings of 13.
For traders specifically looking for a new setup, SNAP is the standout signal with a Strong Entry rating, five of six conditions met and 88% confidence.
The broader message from the data, however, is more selective than the large number of Strong Buy ratings might initially suggest.
Many of the best-performing stocks — including MA, ROKU, NDAQ, SGHT, GRVY, COIN and HOOD — have already moved above their preferred technical entry zones. That increases the importance of waiting for consolidation or pullbacks instead of chasing momentum.
At the other end of the scanner, TTD, PENN and CORZ remain among the weakest technical setups, with confirmed downtrends and strong bearish scores.
For the next trading sessions, the key question will be whether high-ranking momentum stocks can consolidate above support while maintaining bullish volume and directional strength — or whether overbought readings trigger the pullback that could create better risk/reward opportunities.
Disclaimer: This article is based on technical scanner data supplied for analysis and is intended for informational and educational purposes only. Technical indicators can change quickly and do not guarantee future returns. Investors should conduct independent research and consider their own risk tolerance before making investment decisions.
Related Articles
Disclaimer : The above information is for general informational purposes only. All information on the Site is provided in good faith, however we make no representation or warranty of any kind, express or implied, regarding the accuracy, adequacy, validity, reliability, availability or completeness of any information on the Site.