10 Stocks with 100% Confidence Buy Signals This April 2026
MarketsHost.com's April 2026 scanner reveals 10 stocks with strong entry signals. Discover tickers like TGT and FDX, boasting 100% confidence ratings and bullish MACD indicators.
by Kowsalya
Published Apr 28, 2026 | Updated Apr 28, 2026 | 📖 11 min read
Article continues below advertisement

MarketsHost.com: Top 10 Strong Entry Signals for April 2026
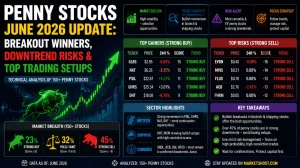
As April 2026 draws to a close, the MarketsHost.com OpportunityRadar scanner has identified a compelling set of equity opportunities, with several tickers registering high conviction 'BUY' signals. Leading the pack in overall OpportunityRadar Score is Target Corporation (TGT) at 73, backed by a robust fundamental score of 75 and a technical score of 71. Hot on its heels is FedEx Corporation (FDX), scoring 71 overall with equally strong fundamentals at 75. Meanwhile, Monolithic Power Systems, Inc. (MPWR) stands out with an exceptional 1-month return of 49.08%, showcasing significant recent upward momentum.
This week's scan highlights a broad alignment of positive indicators across the selected opportunities. Out of the top ten tickers, six boast a perfect 100% confidence rating in their 'BUY' or 'STRONG BUY' signals, underscoring a high degree of technical and fundamental confirmation. The average Relative Strength Index (RSI) across these ten tickers sits at approximately 59.46, suggesting healthy momentum without entering overbought territory. Furthermore, a strong majority of eight tickers exhibit a 'MACD BULL' signal, indicating positive short-term price momentum, while two tickers, FVCBankcorp, Inc. (FVCB) and Definium Therapeutics, Inc. (DFTX), received the more assertive 'STRONG BUY' signal.
Top 10 Signals at a Glance
| # | Ticker | Company | Price | Score | Confidence | RSI | MACD | 1-Month Return |
|---|---|---|---|---|---|---|---|---|
| 1 | TGT | Target Corporation | $129.78 | 73 | 100% | 64.1 | BULL | 9.26% |
| 2 | FDX | FedEx Corporation | $386.28 | 71 | 100% | 58.8 | BULL | 13.03% |
| 3 | FVCB | FVCBankcorp, Inc. | $15.81 | 68 | 100% | 64.1 | BULL | 5.33% |
| 4 | EG | Everest Group, Ltd. | $348.87 | 66 | 100% | 60.9 | BULL | 7.90% |
| 5 | ONB | Old National Bancorp | $23.97 | 66 | 100% | 59.6 | BULL | 11.57% |
| 6 | DFTX | Definium Therapeutics, Inc. | $21.01 | 65 | 83% | 49.8 | BEAR | 20.09% |
| 7 | PSA | Public Storage | $307.25 | 65 | 100% | 60.6 | BULL | 15.89% |
| 8 | VFS | VinFast Auto Ltd. | $4.09 | 65 | 83% | 52.0 | BEAR | 13.43% |
| 9 | JLL | Jones Lang LaSalle Incorporate | $341.38 | 65 | 83% | 61.3 | BULL | 14.94% |
| 10 | MPWR | Monolithic Power Systems, Inc. | $1494.31 | 65 | 83% | 63.4 | BULL | 49.08% |
#1: TGT — Target Corporation
Target Corporation (TGT) registers an OpportunityRadar Score of 73, positioning it as the top-ranked ticker in this scan. This score is supported by a strong fundamental component of 75 and a technical component of 71. The scanner issues a 'BUY' signal with a perfect 100% confidence rating, indicating a high degree of alignment across the underlying metrics. TGT's technical posture includes an RSI of 64.1, suggesting healthy price momentum without being overextended, complemented by a 'MACD BULL' signal. Over the past month, TGT has delivered a return of 9.26%, extending its 3-month gain to 27.56%.
Despite the strong overall score and high confidence, a notable factor for TGT is its Risk/Reward ratio of 0.3. This low ratio suggests that the potential upside, based on the scanner's parameters, may be limited relative to the identified risk. Investors should consider this quantitative assessment when evaluating the stock, even with its robust fundamental and technical scores.
#2: FDX — FedEx Corporation
FedEx Corporation (FDX) appears on the radar with an OpportunityRadar Score of 71, driven by a strong fundamental score of 75 and a technical score of 68. The scanner has issued a 'BUY' signal for FDX, accompanied by a 100% confidence rating, pointing to a robust consensus among the analytical components. Technically, FDX's RSI stands at 58.8, indicating favorable momentum, and its MACD is in 'BULL' territory. The stock has demonstrated solid performance, with a 1-month return of 13.03% and a 3-month return of 22.76%.
Similar to TGT, FedEx Corporation (FDX) also presents a low Risk/Reward ratio of 0.3. While its recent returns and strong fundamental and technical scores are compelling, this low ratio suggests that the potential reward may not be significantly greater than the risk, according to the OpportunityRadar's assessment. This numerical indicator warrants consideration for those evaluating the stock's entry point.
#3: FVCB — FVCBankcorp, Inc.
FVCBankcorp, Inc. (FVCB) stands out with a 'STRONG BUY' signal and a 100% confidence rating, despite an overall OpportunityRadar Score of 68. This strong signal is primarily fueled by an impressive technical score of 82, although its fundamental score is lower at 47. The stock's RSI is at 64.1, indicating positive momentum, and its MACD is firmly in 'BULL' territory. Unlike the previous two tickers, FVCB boasts a favorable Risk/Reward ratio of 2.0. Its recent performance shows a 1-month return of 5.33% and a 3-month return of 6.54%.
While FVCB carries a 'STRONG BUY' signal and a high technical score, its relatively lower 1-month and 3-month returns of 5.33% and 6.54% respectively, when compared to some peers on this list, could be a point of consideration. Additionally, its fundamental score of 47 is the lowest among the top 10, suggesting that the 'STRONG BUY' signal is heavily weighted towards technical factors rather than underlying fundamental strength.
#4: EG — Everest Group, Ltd.
Everest Group, Ltd. (EG) has garnered a 'BUY' signal with a 100% confidence rating and an OpportunityRadar Score of 66. The technical component scores 73, while the fundamental component scores 55, contributing to the overall assessment. The stock's technical indicators appear aligned, with an RSI of 60.9, suggesting healthy buying interest, and a 'MACD BULL' signal indicating positive short-term price action. EG has posted a 1-month return of 7.9% and a 3-month return of 7.37%, reflecting consistent, albeit moderate, upward movement.
A point of caution for Everest Group, Ltd. (EG) is its Risk/Reward ratio of 0.6. This ratio, while better than some, still indicates that the potential reward might not be substantially higher than the risk identified by the scanner. This quantitative measure should be factored into any investment decision, despite the 100% confidence in its 'BUY' signal.
#5: ONB — Old National Bancorp
Old National Bancorp (ONB) is another ticker with a 100% confidence 'BUY' signal, supported by an OpportunityRadar Score of 66. Its technical score is 73 and its fundamental score is 56. The stock exhibits a healthy RSI of 59.6, suggesting balanced momentum, and its MACD is in 'BULL' territory. ONB has shown a strong 1-month return of 11.57%, indicating recent upward price action. The Risk/Reward ratio for ONB stands at 1.1, suggesting a more balanced risk-to-potential-reward profile compared to some other tickers on this list.
While ONB has a strong 1-month return and high confidence, its 3-month return is notably low at 0.82%. This minimal gain over a longer period suggests that recent positive momentum might be a newer development or that the stock has experienced significant volatility in the past quarter, potentially indicating a less stable longer-term trend compared to its strong short-term performance.
#6: DFTX — Definium Therapeutics, Inc.
Definium Therapeutics, Inc. (DFTX) receives a 'STRONG BUY' signal with an OpportunityRadar Score of 65. Its technical score is 75, and its fundamental score is 50. However, its confidence rating is 83%, slightly lower than the perfect 100% seen in several other tickers. The stock's RSI is 49.8, indicating neutral momentum, and notably, its MACD is in 'BEAR' territory despite the 'STRONG BUY' signal. DFTX has shown impressive recent performance, with a 1-month return of 20.09% and a 3-month return of 24.79%. The Risk/Reward ratio is a favorable 2.0.
The divergence in technical indicators for DFTX is a significant consideration. Despite the 'STRONG BUY' signal, the MACD is 'BEAR', which typically suggests downward momentum. This conflicting signal, combined with an 83% confidence rating (not 100%), implies that while the scanner sees strong potential, there are underlying technical factors that warrant close monitoring for a potential shift in momentum.
#7: PSA — Public Storage
Public Storage (PSA) enters the list with a 'BUY' signal and a perfect 100% confidence rating, alongside an OpportunityRadar Score of 65. Its technical score is 69, and its fundamental score is 58. The stock's technical posture includes an RSI of 60.6, indicating healthy momentum, and a 'MACD BULL' signal. PSA has demonstrated robust recent gains, with a 1-month return of 15.89% and a 3-month return of 12.19%, reflecting steady upward price action.
A critical observation for Public Storage (PSA) is its very low Risk/Reward ratio of 0.2. This is the lowest ratio among the top 10 tickers, suggesting that the potential for reward, as assessed by the OpportunityRadar, is minimal relative to the associated risk. Despite the 100% confidence in its 'BUY' signal, this quantitative risk assessment should be a primary factor in evaluating the stock.
#8: VFS — VinFast Auto Ltd.
VinFast Auto Ltd. (VFS) receives a 'BUY' signal with an OpportunityRadar Score of 65. Its technical score is 71, and its fundamental score is 56. The confidence rating for VFS is 83%, similar to DFTX, indicating a slightly lower conviction compared to the 100% confidence signals. The stock's RSI is 52.0, showing neutral to slightly positive momentum, but its MACD is in 'BEAR' territory. VFS has posted strong returns, with a 1-month gain of 13.43% and a 3-month gain of 21.51%. The Risk/Reward ratio is a high 2.0.
Similar to DFTX, VinFast Auto Ltd. (VFS) exhibits a 'MACD BEAR' signal despite receiving a 'BUY' recommendation. This technical divergence, coupled with the 83% confidence rating, suggests that while the scanner identifies potential, there are conflicting momentum indicators. Investors should closely monitor the MACD trend for a potential shift to 'BULL' to confirm the upward trajectory suggested by its recent strong returns.
#9: JLL — Jones Lang LaSalle Incorporate
Jones Lang LaSalle Incorporate (JLL) is flagged with a 'BUY' signal, an 83% confidence rating, and an OpportunityRadar Score of 65. Its technical score is 69, and its fundamental score is 58. The stock's RSI is 61.3, indicating positive momentum, and its MACD is in 'BULL' territory. JLL has shown a strong 1-month return of 14.94%, suggesting recent upward movement. However, its Risk/Reward ratio stands at a relatively low 0.5.
A key risk factor for Jones Lang LaSalle Incorporate (JLL) is its negative 3-month return of -4.21%. While the stock has seen a strong 1-month rebound of 14.94% and exhibits bullish MACD, the negative longer-term performance suggests that the recent gains might be recovering from a prior dip or that the stock has faced significant headwinds over the past quarter. This past volatility warrants careful consideration.
#10: MPWR — Monolithic Power Systems, Inc.
Monolithic Power Systems, Inc. (MPWR) rounds out our top ten with a 'BUY' signal and an OpportunityRadar Score of 65. Its technical score is 69, and its fundamental score is 58. The confidence rating is 83%. MPWR's technical indicators include an RSI of 63.4, showing strong momentum, and a 'MACD BULL' signal. The stock has delivered an outstanding 1-month return of 49.08% and a robust 3-month return of 28.62%, making it the strongest short-term performer on this list. The Risk/Reward ratio is 1.1.
Despite its impressive recent performance and bullish technicals, the 83% confidence rating for MPWR (rather than 100%) suggests that some underlying factors might not be in perfect alignment with the 'BUY' signal. While the 1-month return of 49.08% is exceptional, investors should be mindful that such rapid gains can sometimes precede periods of consolidation or increased volatility, especially when confidence isn't at its absolute peak.
Key Observations Across the Scan
- High Conviction Signals: Six of the ten profiled tickers—TGT, FDX, FVCB, EG, ONB, and PSA—received a perfect 100% confidence rating for their 'BUY' or 'STRONG BUY' signals, indicating robust alignment across the scanner's confirmation factors.
- Bullish Momentum Dominant: A significant majority of eight tickers (TGT, FDX, FVCB, EG, ONB, PSA, JLL, MPWR) exhibit a 'MACD BULL' signal, suggesting positive short-term price momentum is prevalent across the scan.
- Healthy RSI Levels: The average RSI across these ten tickers is approximately 59.46, indicating generally strong, yet not overextended, buying interest and price momentum.
- Strong Short-Term Returns: Five tickers (FDX, ONB, PSA, JLL, MPWR) delivered 1-month returns exceeding 10%, with Monolithic Power Systems, Inc. (MPWR) notably soaring 49.08% in the past month.
- 'STRONG BUY' Recognition: FVCBankcorp, Inc. (FVCB) and Definium Therapeutics, Inc. (DFTX) both received the highest 'STRONG BUY' signal, highlighting their particular strength in the scanner's assessment.
Key Risk Factors
While the OpportunityRadar scan identifies several compelling 'BUY' opportunities, a closer look at the data reveals specific risk factors that warrant consideration:
- Low Risk/Reward Ratios: Several tickers exhibit notably low Risk/Reward ratios, suggesting that the potential upside may not significantly outweigh the inherent risk based on the scanner's parameters. Target Corporation (TGT) and FedEx Corporation (FDX) both show a ratio of 0.3, while Public Storage (PSA) has an even lower ratio of 0.2. This indicates a quantitatively assessed limited reward potential relative to the risk.
- MACD Divergence in Strong Signals: Definium Therapeutics, Inc. (DFTX) and VinFast Auto Ltd. (VFS) both display a 'MACD BEAR' signal despite receiving 'STRONG BUY' and 'BUY' signals respectively. This divergence in a key momentum indicator, coupled with an 83% confidence rating (not 100%), suggests potential underlying weakness or conflicting signals that could impact future price action.
- Varied 3-Month Performance: While many tickers show strong 1-month gains, some exhibit weaker or even negative 3-month performance. Old National Bancorp (ONB) has a modest 3-month return of 0.82%, while Jones Lang LaSalle Incorporate (JLL) recorded a negative 3-month return of -4.21%. This could indicate recent volatility or a less consistent longer-term trend despite recent short-term strength.
About Our Methodology
OpportunityRadar scans 6,600+ US stocks daily using 15+ technical indicators including RSI, MACD, Bollinger Bands, ADX, Aroon, support/resistance levels, and volume analysis, combined with fundamental metrics. Stocks are scored 0-100 with signals ranging from Accumulate to Strong Buy. Entry confidence is rated 50-100% based on 6 confirmation factors.
Disclaimer: This article is for informational purposes only and does not constitute financial advice. Past performance does not guarantee future results. Always conduct your own research and consult a qualified financial advisor before making investment decisions. Data as of April 28, 2026.
Related Articles
Disclaimer : The above information is for general informational purposes only. All information on the Site is provided in good faith, however we make no representation or warranty of any kind, express or implied, regarding the accuracy, adequacy, validity, reliability, availability or completeness of any information on the Site.