10 Stocks Show Strong Buy Signals, High Confidence — November 2026
Explore 10 stocks flagging strong buy signals and 100% confidence entries on Nov 04, 2026. Analysis covers KFII, CERT, ICLR, and more, highlighting key technicals.
by Kowsalya
Published Nov 04, 2026 | Updated Nov 04, 2026 | 📖 11 min read
Article continues below advertisement
OpportunityRadar Spotlights 10 Stocks with Strong Buy Signals this November
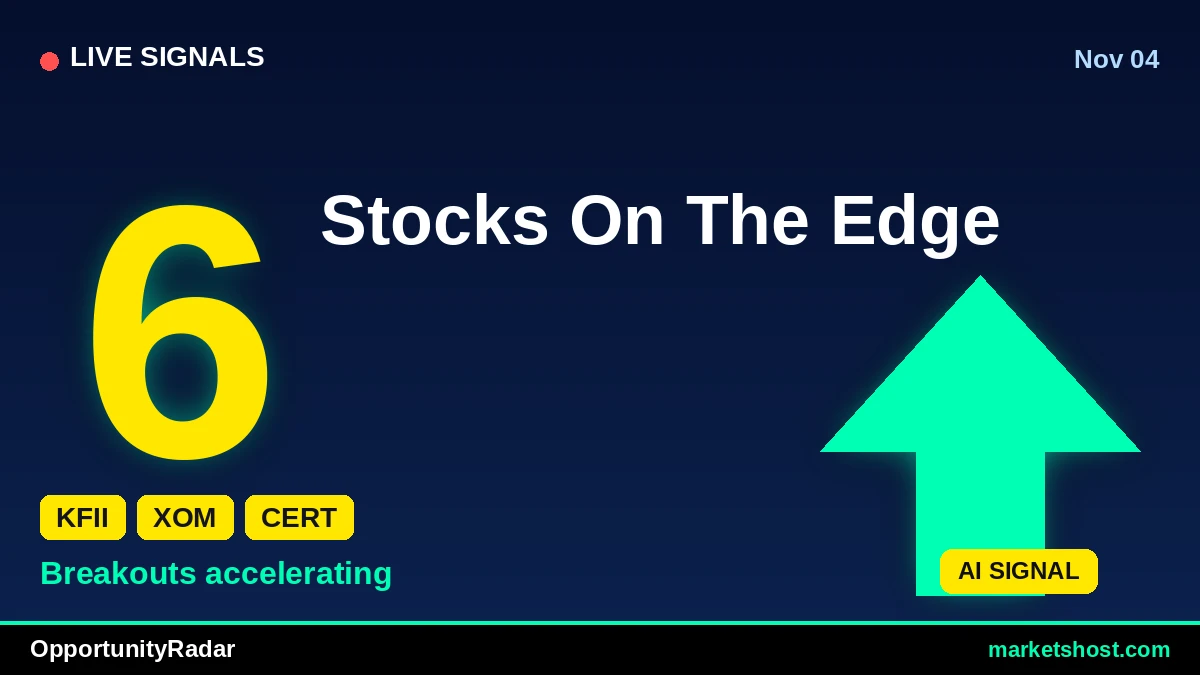
As of November 04, 2026, the MarketsHost.com OpportunityRadar scanner has identified several compelling buy signals across the US equity market. Leading the charge is K&F Growth Acquisition Corp. I (KFII) with the highest overall OpportunityRadar Score of 72, underpinned by a robust technical score of 87 and a 100% confidence rating for its STRONG BUY signal. Other notable tickers like Certara, Inc. (CERT), Ball Corporation (BALL), Teva Pharmaceutical Industries (TEVA), and Pfizer, Inc. (PFE) also registered 100% confidence on their respective BUY signals, indicating a strong confluence of confirming factors.
The current scan reveals a significant number of high-conviction opportunities. Out of the top ten tickers highlighted, five — KFII, CERT, BALL, TEVA, and PFE — are flashing BUY signals with a perfect 100% confidence rating. Furthermore, eight of these ten tickers are displaying a MACD BULL signal, suggesting positive momentum trends. The average Relative Strength Index (RSI) across these ten tickers stands at 58.08, generally indicating healthy price action without being excessively overbought or oversold. Interestingly, four of these top ten have delivered impressive 1-month returns exceeding 10%, with ICON plc (ICLR) leading this group with a 24.69% gain.
Top 10 Signals at a Glance
| # | Ticker | Company | Price | Score | Confidence | RSI | MACD | 1-Month Return |
|---|---|---|---|---|---|---|---|---|
| 1 | KFII | K&F Growth Acquisition Corp. I | $10.81 | 72 | 100% | 56.3 | BULL | 0.93% |
| 2 | XOM | ExxonMobil Holdings Corporatio | $171.37 | 66 | 50% | 44.9 | BEAR | 4.46% |
| 3 | CERT | Certara, Inc. | $10.90 | 66 | 100% | 63.0 | BULL | 21.71% |
| 4 | KO | Coca-Cola Company (The) | $95.85 | 66 | 67% | 65.0 | BULL | 11.69% |
| 5 | BALL | Ball Corporation | $65.72 | 65 | 100% | 58.8 | BULL | 14.34% |
| 6 | TEVA | Teva Pharmaceutical Industries | $41.96 | 63 | 100% | 59.7 | BULL | 7.08% |
| 7 | PFE | Pfizer, Inc. | $30.43 | 63 | 100% | 61.8 | BULL | 8.68% |
| 8 | RNG | Ringcentral, Inc. | $77.27 | 63 | 67% | 46.4 | BEAR | 0.95% |
| 9 | ICLR | ICON plc | $204.59 | 63 | 83% | 66.4 | BULL | 24.69% |
| 10 | RS | Reliance, Inc. | $430.78 | 62 | 100% | 58.5 | BULL | 8.72% |
#1: KFII — K&F Growth Acquisition Corp. I
K&F Growth Acquisition Corp. I (KFII) registers the highest OpportunityRadar Score in this scan at 72, driven significantly by a strong technical score of 87. The scanner issues a STRONG BUY signal with a maximum 100% confidence rating and a STRONG ENTRY recommendation, indicating high conviction from the system. Technical indicators for KFII show an RSI of 56.3, suggesting a balanced momentum, and a MACD in BULL territory, affirming positive trend dynamics. The 1-month return for KFII stands at 0.93%, while its 3-month return is 1.89%, reflecting modest recent price appreciation.
A key observation for KFII is the prevalence of 'N/A' values across several fundamental and technical metrics, including P/E, EPS, D/E, earnings and revenue growth, as well as specific trend, momentum, volume, and risk breakdown scores. This lack of comprehensive data for certain components means the high overall score and confidence are primarily based on the available technical and signal strength, with less insight into underlying fundamental or broader technical context beyond RSI and MACD. The Risk/Reward ratio is noted at 2.0.
#2: XOM — ExxonMobil Holdings Corporatio
ExxonMobil Holdings Corporation (XOM) appears on the scanner with an OpportunityRadar Score of 66, comprising a technical score of 63 and a fundamental score of 70. The system generates a BUY signal, but with a moderate 50% confidence and a PARTIAL ENTRY recommendation, suggesting a more cautious approach. XOM's technical posture includes an RSI of 44.9, which is below the neutral 50-mark, and a MACD indicating a BEAR trend. This divergence between a BUY signal and a BEAR MACD warrants careful consideration.
Despite the cautious technical signal from MACD, XOM has demonstrated positive recent price performance, with a 1-month return of 4.46% and a more substantial 3-month return of 11.98%. The Risk/Reward ratio for XOM is 2.0, indicating a favorable potential reward relative to risk. The lower confidence rating of 50% and the PARTIAL ENTRY signal, combined with the MACD BEAR status, highlight areas for further scrutiny despite the overall BUY recommendation.
#3: CERT — Certara, Inc.
Certara, Inc. (CERT) is flagged with an OpportunityRadar Score of 66, supported by a strong technical score of 74 and a fundamental score of 53. The scanner issues a BUY signal with a perfect 100% confidence rating, coupled with a STRONG ENTRY recommendation. From a technical perspective, CERT's RSI is 63.0, indicating healthy upward momentum without being in overbought territory. The MACD is in a BULL trend, reinforcing the positive technical outlook.
CERT has shown impressive recent price performance, with a 1-month return of 21.71% and a 3-month return of 32.99%, demonstrating significant price appreciation over the past quarter. However, the Risk/Reward ratio for CERT stands at 0.8. This ratio, being below 1.0, suggests that the potential reward might be less than the potential risk based on the system's calculations, a factor that could temper the enthusiasm generated by the high confidence and strong entry signal.
#4: KO — Coca-Cola Company (The)
The Coca-Cola Company (KO) registers an OpportunityRadar Score of 66, with its fundamental score of 70 slightly outweighing its technical score of 63. The system indicates a BUY signal with a 67% confidence rating and an ENTRY recommendation. Technically, KO's RSI is at 65.0, suggesting strong buying pressure, and its MACD is in a BULL trend, reinforcing positive momentum. This aligns with its recent performance, showing a 1-month return of 11.69% and a 3-month return of 10.11%.
While the MACD is bullish and returns are strong, the RSI of 65.0 is approaching the commonly recognized overbought threshold of 70, which could suggest a potential for consolidation or pull-back in the near term. Furthermore, KO’s Risk/Reward ratio is 0.4. This low ratio, significantly below 1.0, implies that the potential reward is considerably less than the potential risk, which is a factor to consider despite the positive technical signals and recent price performance.
#5: BALL — Ball Corporation
Ball Corporation (BALL) is identified with an OpportunityRadar Score of 65, stemming from a technical score of 69 and a fundamental score of 58. The scanner provides a BUY signal with a 100% confidence rating and a STRONG ENTRY recommendation, signifying high conviction. Technically, BALL's RSI is 58.8, indicating a healthy upward momentum without being overextended. The MACD is also in a BULL trend, supporting the positive technical picture.
BALL has delivered solid recent returns, with a 1-month return of 14.34% and a 3-month return of 3.58%. The strong 1-month performance points to recent buying interest. However, the Risk/Reward ratio for BALL is 0.4. Similar to other tickers on this list, a ratio below 1.0 suggests that the potential reward, as calculated by the system, is less than the potential risk, which should be weighed against the strong confidence and entry signal.
#6: TEVA — Teva Pharmaceutical Industries
Teva Pharmaceutical Industries (TEVA) shows an OpportunityRadar Score of 63, with a technical score of 66 and a fundamental score of 58. The system issues a BUY signal with a 100% confidence rating and a STRONG ENTRY recommendation, indicating a high degree of conviction. TEVA's technical profile includes an RSI of 59.7 and a MACD in a BULL trend, both pointing to positive price momentum and a constructive trend.
TEVA has recorded respectable recent returns, with a 1-month return of 7.08% and a robust 3-month return of 18.65%. These figures suggest a sustained positive trend over the past quarter. However, the Risk/Reward ratio for TEVA is notably low at 0.3. This ratio implies a significantly higher potential risk compared to the potential reward, a crucial consideration even with the 100% confidence and strong entry signal.
#7: PFE — Pfizer, Inc.
Pfizer, Inc. (PFE) is featured with an OpportunityRadar Score of 63, composed of a technical score of 69 and a fundamental score of 55. The scanner generates a BUY signal, backed by a 100% confidence rating and a STRONG ENTRY recommendation. PFE's technical indicators include an RSI of 61.8, suggesting positive momentum, and a MACD in a BULL trend, confirming an upward price trajectory.
PFE has shown positive recent performance, with a 1-month return of 8.68% and a 3-month return of 13.71%, indicating consistent gains over the past few months. Despite the strong confidence and positive technicals, the Risk/Reward ratio for PFE is the lowest among the top ten tickers at 0.2. This extremely low ratio suggests that the potential reward is substantially less than the potential risk, which is a significant factor to consider when evaluating this signal.
#8: RNG — Ringcentral, Inc.
Ringcentral, Inc. (RNG) holds an OpportunityRadar Score of 63, with a technical score of 68 and a fundamental score of 56. The system provides a BUY signal with a 67% confidence rating and an ENTRY recommendation. Technically, RNG's RSI is 46.4, indicating a slightly weaker momentum compared to many other tickers on this list, and its MACD is in a BEAR trend. This MACD BEAR signal presents a notable divergence from the overall BUY signal.
RNG's recent returns show a mixed picture: a modest 1-month return of 0.95% but a strong 3-month return of 22.63%. The significant 3-month gain suggests prior strength, but the low 1-month return and the current MACD BEAR signal indicate a recent shift in momentum. The Risk/Reward ratio for RNG is 2.0, which is a favorable ratio, suggesting potential for reward relative to risk, but this must be balanced against the bearish MACD and lower confidence.
#9: ICLR — ICON plc
ICON plc (ICLR) is flagged with an OpportunityRadar Score of 63, derived from a technical score of 67 and a fundamental score of 58. The scanner issues a BUY signal with an 83% confidence rating and a STRONG ENTRY recommendation. ICLR's technical indicators are robust, with an RSI of 66.4, indicating strong upward momentum. The MACD is also in a BULL trend, confirming the positive price action.
ICLR has been a strong performer, delivering a 1-month return of 24.69% and a 3-month return of 24.36%. These impressive returns suggest significant buying interest and a well-established uptrend. While the RSI of 66.4 is strong, it is approaching the 70 level, which often signals overbought conditions. The Risk/Reward ratio for ICLR is 0.7. This ratio, being below 1.0, suggests that the potential reward is less than the potential risk, a factor to consider despite the strong technicals and recent performance.
#10: RS — Reliance, Inc.
Reliance, Inc. (RS) completes our top ten list with an OpportunityRadar Score of 62, featuring a technical score of 65 and a fundamental score of 58. The system gives a BUY signal with a perfect 100% confidence rating and a STRONG ENTRY recommendation. RS's technicals include an RSI of 58.5, indicating healthy momentum, and a MACD in a BULL trend, reinforcing a positive price trajectory.
RS has shown positive recent returns, with a 1-month return of 8.72%. Its 3-month return is 1.63%, suggesting more recent acceleration in price appreciation. The 100% confidence rating and STRONG ENTRY signal highlight the system's conviction. However, the Risk/Reward ratio for RS is 0.6. This ratio, below 1.0, indicates that the potential reward is less than the potential risk, which should be carefully considered alongside the strong signal and technical alignment.
Key Observations Across the Scan
A review of the top 10 tickers reveals several notable trends. Five of the ten tickers—KFII, CERT, BALL, TEVA, and PFE—are presenting BUY signals with a maximum 100% confidence rating, suggesting a high degree of alignment across the OpportunityRadar's confirmation factors. Eight out of the ten tickers, including KFII, CERT, KO, BALL, TEVA, PFE, ICLR, and RS, show their MACD in BULL territory, indicating positive momentum. The average RSI across these ten tickers is 58.08, generally pointing to healthy, non-overextended price action. Four tickers—CERT (21.71%), KO (11.69%), BALL (14.34%), and ICLR (24.69%)—have delivered strong 1-month returns exceeding 10%, with ICLR leading this group. Conversely, XOM and RNG are the only two tickers among the top ten exhibiting a MACD BEAR signal despite their BUY recommendations. The Risk/Reward ratios show a wide range, from a low of 0.2 for PFE to a high of 2.0 for KFII, XOM, and RNG.
Key Risk Factors
- Divergent MACD Signals: ExxonMobil Holdings Corporation (XOM) and Ringcentral, Inc. (RNG) both show a MACD BEAR signal despite receiving a BUY signal from the OpportunityRadar. For XOM, this is coupled with a 50% confidence and PARTIAL ENTRY, while RNG has a 67% confidence and ENTRY. This divergence between the BUY signal and a bearish MACD warrants careful monitoring, as it could indicate weakening momentum not fully captured by the overall score.
- Low Risk/Reward Ratios: Several tickers exhibit Risk/Reward ratios significantly below 1.0. Pfizer, Inc. (PFE) stands out with the lowest ratio of 0.2, followed by Teva Pharmaceutical Industries (TEVA) at 0.3, Coca-Cola Company (KO) and Ball Corporation (BALL) both at 0.4, Reliance, Inc. (RS) at 0.6, Certara, Inc. (CERT) at 0.8, and ICON plc (ICLR) at 0.7. A ratio below 1.0 implies that the potential reward, as calculated by the system, is less than the potential risk, which could indicate a less favorable risk-adjusted opportunity.
- Incomplete Data for Analysis: K&F Growth Acquisition Corp. I (KFII), despite having the highest OpportunityRadar Score of 72 and a 100% confidence STRONG BUY signal, has numerous 'N/A' values across its fundamental and detailed technical breakdown scores. This lack of data for metrics like Trend, Momentum, Volume, and Risk scores, as well as all fundamental ratios, limits a comprehensive understanding of the underlying factors contributing to its high rating beyond the available RSI and MACD status.
About Our Methodology
OpportunityRadar scans 6,600+ US stocks daily using 15+ technical indicators including RSI, MACD, Bollinger Bands, ADX, Aroon, support/resistance levels, and volume analysis, combined with fundamental metrics. Stocks are scored 0-100 with signals ranging from Accumulate to Strong Buy. Entry confidence is rated 50-100% based on 6 confirmation factors.
Disclaimer: This article is for informational purposes only and does not constitute financial advice. Past performance does not guarantee future results. Always conduct your own research and consult a qualified financial advisor before making investment decisions. Data as of November 04, 2026.
Related Articles
Disclaimer : The above information is for general informational purposes only. All information on the Site is provided in good faith, however we make no representation or warranty of any kind, express or implied, regarding the accuracy, adequacy, validity, reliability, availability or completeness of any information on the Site.