10 Stocks Flashing 100% Confidence Buy Signals in October 2026
MarketsHost.com identifies 10 stocks with strong BUY signals and 100% confidence ratings for October 2026. Featuring MACD BULL and robust 1-month returns.
by Kowsalya
Published Oct 27, 2026 | Updated Oct 27, 2026 | 📖 12 min read
Article continues below advertisement
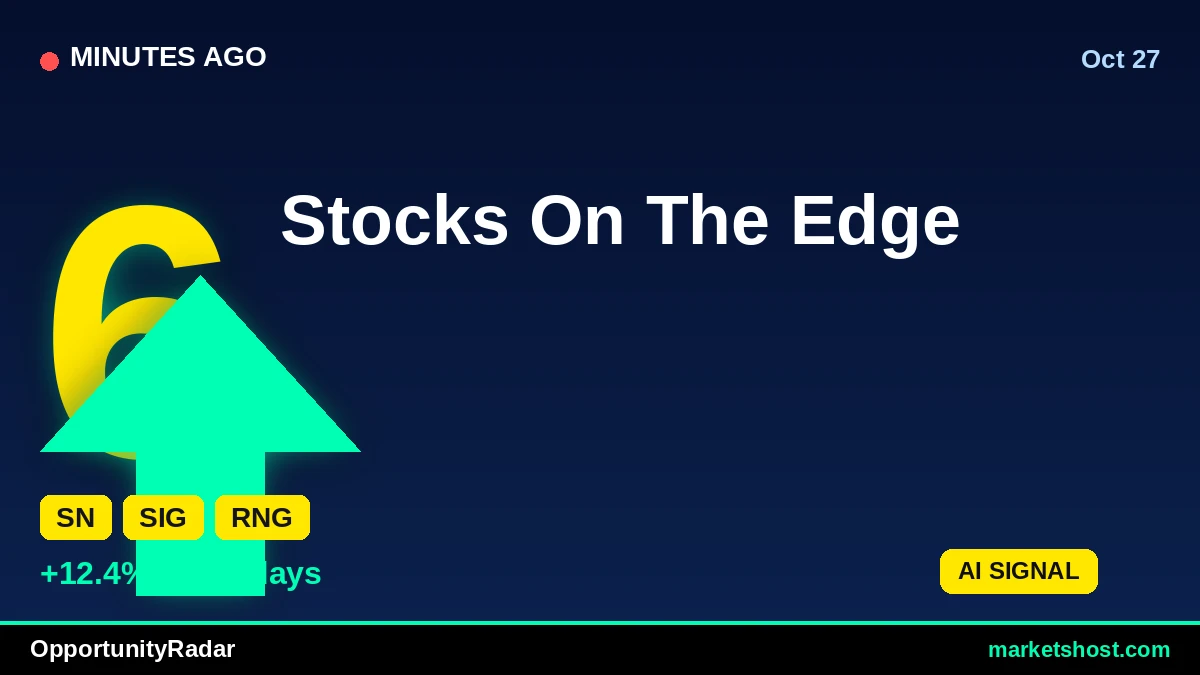
OpportunityRadar Spotlights 10 Strong Buy Signals for October 2026
As October 2026 draws to a close, MarketsHost.com's OpportunityRadar scanner has identified a select group of stocks exhibiting compelling technical indicators and strong buy signals. Leading this week's top picks is SharkNinja, Inc. (SN), which registered the highest OpportunityRadar Score of 66, driven by a robust technical score of 71. SN, currently priced at $196.26, also boasts a 100% confidence rating for its BUY signal, underpinned by a MACD BULL indication and a 7.58% gain over the last month.
This exclusive list of 10 tickers, all flagged with a 'STRONG ENTRY' recommendation, uniformly display a 100% confidence rating on their BUY signals. Across these top selections, every single ticker shows a MACD BULL signal, indicating broad positive momentum. Monthly returns for these stocks range significantly, with some like Ringcentral, Inc. (RNG) posting an impressive 15.38% gain in the last month and a remarkable 60.58% over three months, while others like Remitly Global, Inc. (RELY) show a more modest 3.92% 3-month return. The average OpportunityRadar Score for this group stands at 64.1, with an average technical score of 69.1 and an average fundamental score of 55.4.
Top 10 Signals at a Glance
| # | Ticker | Company | Price | Score | Confidence | RSI | MACD | 1-Month Return |
|---|---|---|---|---|---|---|---|---|
| 1 | SN | SharkNinja, Inc. | $196.26 | 66 | 100% | 61.1 | BULL | 7.58% |
| 2 | SIG | Signet Jewelers Limited | $117.14 | 64 | 100% | 67.5 | BULL | 12.29% |
| 3 | RNG | Ringcentral, Inc. | $85.88 | 64 | 100% | 63.3 | BULL | 15.38% |
| 4 | RELY | Remitly Global, Inc. | $24.37 | 63 | 100% | 54.7 | BULL | 13.51% |
| 5 | FRSH | Freshworks Inc. | $15.03 | 63 | 100% | 64.7 | BULL | 19.52% |
| 6 | ASH | Ashland Inc. | $72.87 | 63 | 100% | 58.7 | BULL | 6.47% |
| 7 | SHEL | Shell PLC | $105.04 | 63 | 100% | 62.3 | BULL | 10.41% |
| 8 | DMAC | DiaMedica Therapeutics Inc. | $8.48 | 63 | 100% | 58.0 | BULL | 3.48% |
| 9 | EXLS | ExlService Holdings, Inc. | $40.67 | 63 | 100% | 63.4 | BULL | 17.6% |
| 10 | CI | The Cigna Group | $302.08 | 63 | 100% | 59.7 | BULL | 9.74% |
#1: SN — SharkNinja, Inc.
SharkNinja, Inc. (SN) is currently priced at $196.26, leading our scan with an OpportunityRadar Score of 66. This score is notably supported by a strong technical score of 71, indicating favorable chart patterns and indicator readings. The system has issued a 'BUY' signal with a perfect 100% confidence rating, designating it as a 'STRONG ENTRY'. Technical indicators for SN include an RSI of 61.1, which suggests healthy momentum without approaching overbought conditions, and a MACD in BULL territory, reinforcing the positive sentiment observed. Over the past month, SN has delivered a 7.58% return, extending to a 20.16% gain over three months.
Despite the strong overall score and technical alignment, investors should note the Risk/Reward ratio of 0.2 for SN. This ratio, being the lowest among the top 10 tickers, suggests that the potential reward relative to the indicated risk (as defined by the stop level) is comparatively limited. While the 100% confidence and MACD BULL signal are compelling, a lower Risk/Reward ratio implies a tighter window for potential gains compared to the risk assumed.
#2: SIG — Signet Jewelers Limited
Signet Jewelers Limited (SIG) presents a compelling profile with an OpportunityRadar Score of 64, backed by a technical score of 69 and a fundamental score of 56. Trading at $117.14, SIG has received a 'BUY' signal with a 100% confidence rating and a 'STRONG ENTRY' recommendation. The technical picture for SIG includes an RSI of 67.5, which is the highest among the top 10 tickers, signaling robust buying interest. The MACD is also firmly in BULL territory, confirming the upward price momentum. Performance-wise, SIG has seen a 12.29% return over the last month and an impressive 22.18% gain over the three-month period.
While the strong returns and MACD BULL signal are positive, the RSI of 67.5 for SIG warrants attention. Although not explicitly in 'overbought' territory according to standard interpretations, it is nearing the upper bound of typical RSI ranges, suggesting that the stock has experienced significant upward movement recently. Additionally, SIG's Risk/Reward ratio stands at 0.5, which is on the lower side, indicating a moderate potential reward relative to the risk identified by the system.
#3: RNG — Ringcentral, Inc.
Ringcentral, Inc. (RNG), priced at $85.88, registers an OpportunityRadar Score of 64, with a technical score of 69 and a fundamental score of 56. The scanner has issued a 'BUY' signal for RNG, accompanied by a 100% confidence rating and a 'STRONG ENTRY' indication. Technical analysis reveals an RSI of 63.3, positioning it comfortably in bullish territory without showing signs of immediate overextension. The MACD indicator also confirms a BULL trend, reinforcing the positive outlook from a momentum perspective. RNG has demonstrated exceptional performance, with a 15.38% return over the last month and a substantial 60.58% gain over the past three months, making it the strongest 3-month performer in this top 10 list.
A notable aspect for RNG is its Risk/Reward ratio of 1.4, which is the highest among the profiled tickers. While a higher Risk/Reward ratio generally suggests a greater potential return for each unit of risk taken, it also implies that the stock may exhibit higher volatility or a wider range of potential outcomes. Investors considering RNG should be aware of this elevated ratio in the context of its strong recent performance.
#4: RELY — Remitly Global, Inc.
Remitly Global, Inc. (RELY) is trading at $24.37 and has an OpportunityRadar Score of 63, comprising a technical score of 69 and a fundamental score of 53. The system has identified a 'BUY' signal for RELY with 100% confidence, marking it as a 'STRONG ENTRY'. Technical indicators show an RSI of 54.7, which is the lowest among these top 10 picks, suggesting a more tempered, yet still positive, momentum. The MACD is in BULL status, aligning with the overall positive signal. In terms of returns, RELY has posted a 13.51% gain over the last month, though its three-month return is a more modest 3.92%.
The divergence between RELY's recent 1-month performance and its 3-month return is a point to consider. While the 13.51% monthly gain is strong, the 3.92% return over three months indicates that the recent momentum might be a newer development following a period of more subdued performance. This contrast between short-term and medium-term returns, coupled with a Risk/Reward ratio of 0.5, suggests that while there is positive recent movement, the longer-term trend has been less pronounced compared to some other tickers on this list.
#5: FRSH — Freshworks Inc.
Freshworks Inc. (FRSH), currently priced at $15.03, has an OpportunityRadar Score of 63, with a technical score of 68 and a fundamental score of 56. The scanner indicates a 'BUY' signal with 100% confidence and a 'STRONG ENTRY'. FRSH's technical strength is highlighted by an RSI of 64.7, reflecting significant buying interest. The MACD is also in BULL territory, reinforcing the positive trend. The stock has demonstrated robust recent performance, with a 19.52% return over the last month, making it the top 1-month performer in this selection, and a strong 33.53% gain over the past three months.
Despite the impressive short-term and medium-term returns, FRSH exhibits a Risk/Reward ratio of 0.3. This relatively low ratio suggests that the potential upside from the current price, relative to the defined stop-loss level, is not as expansive as some other opportunities. While the technical momentum is strong, investors should weigh this factor when considering the position's overall risk profile.
#6: ASH — Ashland Inc.
Ashland Inc. (ASH) is trading at $72.87 and has an OpportunityRadar Score of 63, supported by a technical score of 69 and a fundamental score of 53. The system has generated a 'BUY' signal for ASH with a 100% confidence rating, designating it as a 'STRONG ENTRY'. Technical indicators show an RSI of 58.7, indicating healthy, sustained momentum without being overextended. The MACD is also in a BULL configuration, further confirming the positive price action. Over the past month, ASH has returned 6.47%, but its three-month performance shows a more modest 0.23% gain.
The significantly lower three-month return of 0.23% for ASH, especially when compared to its 6.47% one-month return, points to a recent acceleration in price action after a period of relative flatness. This divergence between short-term and medium-term returns suggests that while recent momentum is positive, the broader trend over the last quarter has been less dynamic. The Risk/Reward ratio of 0.8 also indicates a balanced, but not exceptionally high, potential reward relative to risk.
#7: SHEL — Shell PLC
Shell PLC (SHEL), currently priced at $105.04, holds an OpportunityRadar Score of 63, derived from a technical score of 68 and a fundamental score of 55. The scanner has issued a 'BUY' signal with a 100% confidence rating, categorizing it as a 'STRONG ENTRY'. SHEL's technical posture includes an RSI of 62.3, which is indicative of solid upward momentum without nearing overbought conditions. The MACD indicator is also in a BULL state, aligning with the positive signal. In terms of recent performance, SHEL has delivered a 10.41% return over the last month and a 16.05% gain over the past three months.
A key factor for SHEL is its Risk/Reward ratio of 0.3. This ratio is among the lower values in this selection of top signals, suggesting that the potential reward, as measured against the system's defined stop level, is relatively constrained. While the technical indicators and recent returns are positive, a lower Risk/Reward ratio implies that the magnitude of potential gains may be limited compared to the risk involved in the position.
#8: DMAC — DiaMedica Therapeutics Inc.
DiaMedica Therapeutics Inc. (DMAC), priced at $8.48, has an OpportunityRadar Score of 63, with a technical score of 69 and a fundamental score of 53. The system highlights a 'BUY' signal for DMAC with a 100% confidence rating and a 'STRONG ENTRY' recommendation. Technical indicators for DMAC show an RSI of 58.0, reflecting a healthy upward momentum. The MACD is also in BULL territory, confirming the positive trend. While its one-month return stands at 3.48%, DMAC has delivered a robust 30.34% return over the past three months, indicating strong underlying momentum over the medium term.
Despite the impressive three-month performance, DMAC's one-month return of 3.48% is the lowest among the top 10 tickers profiled. This suggests that while the stock has seen significant gains over the past quarter, the most immediate short-term momentum might be less pronounced than some of its peers. The Risk/Reward ratio of 0.6 indicates a moderate balance between potential reward and risk, but the recent slower monthly gain could be a point of observation for new entries.
#9: EXLS — ExlService Holdings, Inc.
ExlService Holdings, Inc. (EXLS), trading at $40.67, has an OpportunityRadar Score of 63, with a technical score of 68 and a fundamental score of 56. The scanner has issued a 'BUY' signal for EXLS, accompanied by a 100% confidence rating and a 'STRONG ENTRY' designation. Technical analysis shows an RSI of 63.4, indicating solid buying pressure and momentum. The MACD is in BULL status, reinforcing the positive trend identified by the system. EXLS has demonstrated strong performance, with a 17.6% return over the last month and an 18.35% gain over the past three months.
EXLS's Risk/Reward ratio is 0.6, which falls in the mid-range of the top 10 tickers. This ratio suggests a moderate potential reward relative to the identified risk. While the stock's recent returns are strong and its technical indicators are aligned with a 'BUY' signal, investors should consider this ratio when assessing the overall attractiveness and risk management for a potential position in EXLS.
#10: CI — The Cigna Group
The Cigna Group (CI) is currently priced at $302.08, making it the highest-priced stock in this selection. It holds an OpportunityRadar Score of 63, with a technical score of 69 and a fundamental score of 55. The system has generated a 'BUY' signal for CI, supported by a 100% confidence rating and a 'STRONG ENTRY' recommendation. Technical indicators include an RSI of 59.7, reflecting healthy positive momentum without signs of being overbought. The MACD is also in BULL territory, indicating a continuation of the upward trend. CI has posted a 9.74% return over the last month and a 5.01% gain over the past three months.
The three-month return of 5.01% for CI, while positive, is lower than many of its peers on this list, especially considering its robust 1-month return of 9.74%. This suggests that while recent performance has been strong, the medium-term trend has been more subdued. The Risk/Reward ratio for CI is 0.5, indicating a moderate potential reward in relation to the system's calculated risk, which should be considered alongside the stock's price and historical performance.
Key Observations Across the Scan
- All 10 profiled tickers received a 'BUY' signal with a 100% confidence rating and a 'STRONG ENTRY' designation, indicating a high degree of alignment in the OpportunityRadar system's assessment.
- Every single ticker in this top 10 list exhibits a MACD BULL signal, suggesting widespread positive momentum across these selections.
- The average RSI for these 10 stocks is 61.34, indicating healthy buying interest without, for the most part, reaching typically overbought conditions.
- Six out of the 10 tickers (SIG, RNG, RELY, FRSH, SHEL, EXLS) posted 1-month returns exceeding 10%, highlighting strong recent performance across a significant portion of the list.
- Four tickers (SN, SIG, RNG, FRSH) demonstrated 3-month returns greater than 20%, with Ringcentral, Inc. (RNG) leading this group with an impressive 60.58% gain.
- Risk/Reward ratios vary considerably within this group, ranging from a low of 0.2 for SharkNinja, Inc. (SN) to a high of 1.4 for Ringcentral, Inc. (RNG).
Key Risk Factors
- Lower Risk/Reward Ratios: Several tickers, including SharkNinja, Inc. (SN) with 0.2, Freshworks Inc. (FRSH) with 0.3, and Shell PLC (SHEL) also with 0.3, exhibit relatively low Risk/Reward ratios. This indicates that the potential reward, as defined by the system's targets relative to its stop levels, is comparatively limited. Investors should carefully evaluate if the potential upside justifies the inherent risk for these specific opportunities.
- Divergent Short-Term vs. Medium-Term Returns: For certain stocks like Remitly Global, Inc. (RELY) (1M: 13.51%, 3M: 3.92%) and Ashland Inc. (ASH) (1M: 6.47%, 3M: 0.23%), there's a notable disparity where strong recent 1-month gains are not fully reflected in their 3-month performance. This suggests that the current positive momentum might be a more recent development rather than a continuation of a sustained, longer-term trend.
- RSI Approaching Upper Bounds: Signet Jewelers Limited (SIG) shows an RSI of 67.5, which, while not crossing the traditional 70-mark for 'overbought,' is at the higher end of the spectrum among these selections. This elevated RSI suggests that the stock has experienced significant upward price movement in the short term, which could potentially lead to a consolidation or pullback, warranting closer observation for sustained momentum.
About Our Methodology
OpportunityRadar scans 6,600+ US stocks daily using 15+ technical indicators including RSI, MACD, Bollinger Bands, ADX, Aroon, support/resistance levels, and volume analysis, combined with fundamental metrics. Stocks are scored 0-100 with signals ranging from Accumulate to Strong Buy. Entry confidence is rated 50-100% based on 6 confirmation factors.
Disclaimer: This article is for informational purposes only and does not constitute financial advice. Past performance does not guarantee future results. Always conduct your own research and consult a qualified financial advisor before making investment decisions. Data as of October 27, 2026.
Related Articles
Disclaimer : The above information is for general informational purposes only. All information on the Site is provided in good faith, however we make no representation or warranty of any kind, express or implied, regarding the accuracy, adequacy, validity, reliability, availability or completeness of any information on the Site.