Top Breakout & Momentum Stocks to Watch Today (May 2026) – SOUN, SIFY, AAPL & AMD Insights
Discover May 2026’s top breakout and momentum stocks like SOUN, SIFY, AAPL, and AMD. Get actionable trading insights with RSI, MACD, ADX, and volume analysis for high-conviction market moves
by Kowsalya
Published May 08, 2026 | Updated May 08, 2026 | 📖 3 min read
Article continues below advertisement
 – SOUN, SIFY, AAPL & AMD Insights")
Top Momentum & Breakout Stocks to Watch Today (May 2026) – Expert Market Insights
Looking for the best trading opportunities today? Our latest analysis highlights high-conviction breakout and momentum stocks using key technical indicators such as RSI, MACD, ADX, and volume trends. Discover which stocks are primed for gains and which to avoid in today’s market.
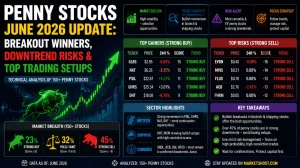
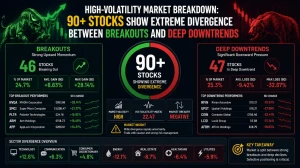
Key Stocks Showing Strong Momentum
Investors can focus on breakout and trend continuation stocks with high conviction. Below are the top momentum picks:
| Stock | Price | Trend | RSI | MACD | Entry Type | Signal |
|---|---|---|---|---|---|---|
| SOUN | $9.63 | Bullish | 66.6 | Bullish | Trend continuation | Strong Buy |
| SIFY | $15.55 | Bearish (recently) | 53.0 | Neutral | Breakout | Strong Buy |
| AAPL | $287.44 | Bullish | 69.3 | Bullish | Trend continuation | Strong Buy |
| AMD | $408.46 | Bullish | 76.1 (Overbought) | Bullish | Trend continuation | Strong Buy |
| IONQ | $47.68 | Bullish | 60.5 | Neutral | Trend continuation | Strong Buy |
| MRAM | $21.51 | Bullish | 75.0 | Overbought | Trend continuation | Take Profit |
Featured Snippet: Momentum stocks like SOUN, SIFY, AAPL, and AMD are showing breakout potential, while IONQ and MRAM are trending upward with strong volume confirmation.
Stocks Showing Risk or Downtrend
Avoid investing in stocks currently in downtrends or with weak technical indicators:
| Stock | Price | Trend | RSI | MACD | Signal |
|---|---|---|---|---|---|
| LAZR | $3.89 | Bearish | 27.5 | Bearish | Strong Sell |
| SGMO | $0.10 | Bearish | 31.9 | Bearish | Strong Sell |
| BWEN | $2.11 | Bearish | 43.0 | Bearish | Avoid |
| SIDU | $2.95 | Bearish | 44.5 | Bearish | Avoid |
Understanding Key Technical Indicators
1. Relative Strength Index (RSI)
RSI measures overbought (>70) or oversold (<30) conditions. For instance, AMD with RSI 76.1 is overbought, cautioning traders despite bullish trends.
2. Moving Average Convergence Divergence (MACD)
MACD bullish crossovers indicate potential breakout opportunities. Stocks like SOUN and SIFY show MACD bullish confirmation.
3. Average Directional Index (ADX)
ADX above 25 signals strong trend strength. Downtrending stocks like LAZR are confirmed by high ADX readings.
4. On-Balance Volume (OBV)
OBV trend alignment with price indicates volume-supported moves. For example, MRAM shows rising OBV, validating bullish momentum.
How to Use This Stock Analysis
- Prioritize breakout and momentum stocks with RSI < 70 to avoid extreme overbought conditions.
- Confirm trend strength using MACD and ADX.
- Monitor volume trends (OBV) for entry validation.
- Set stop-loss and risk/reward according to volatility metrics (ATR, W%R).
Market Snapshot – Top Picks vs Risk Stocks
| Category | Stock | Entry Signal | RSI | MACD | Trend | Recommendation |
|---|---|---|---|---|---|---|
| Momentum / Breakout | SOUN | Trend continuation | 66.6 | Bullish | Bullish | Strong Buy |
| Momentum / Breakout | SIFY | Breakout | 53.0 | Neutral | Bearish | Strong Buy |
| Momentum / Breakout | AMD | Trend continuation | 76.1 | Bullish | Bullish | Strong Buy |
| Momentum / Breakout | IONQ | Trend continuation | 60.5 | Neutral | Bullish | Strong Buy |
| Downtrend / Avoid | LAZR | EXIT NOW | 27.5 | Bearish | Bearish | Strong Sell |
| Downtrend / Avoid | SGMO | EXIT NOW | 31.9 | Bearish | Bearish | Strong Sell |
| Downtrend / Avoid | BWEN | WAIT | 43.0 | Bearish | Bearish | Avoid |
| Downtrend / Avoid | SIDU | WAIT | 44.5 | Bearish | Bearish | Avoid |
Today's market favors momentum and breakout stocks like SOUN, SIFY, AAPL, and AMD. Traders should avoid strong downtrends like LAZR and SGMO. Combining RSI, MACD, ADX, and volume ensures higher conviction trades and better risk management.
Related Articles
Disclaimer : The above information is for general informational purposes only. All information on the Site is provided in good faith, however we make no representation or warranty of any kind, express or implied, regarding the accuracy, adequacy, validity, reliability, availability or completeness of any information on the Site.