Cannabis & Pharma Stocks 2026: Top Picks, Buy/Sell Signals, and Market Trends
Explore top cannabis & pharma stocks in 2026 with buy/sell signals, technical insights, and actionable trends. Key picks include CRON, CURLF, JAZZ, INCY, TEVA for investors and traders.
by Kowsalya
Published May 12, 2026 | Updated May 12, 2026 | 📖 3 min read
Article continues below advertisement

Cannabis & Pharma Stocks 2026: Top Picks, Buy/Sell Signals, and Market Trends
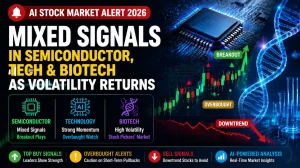
Investors looking for the most promising cannabis and pharma stocks in 2026 can make informed decisions using this comprehensive guide. Based on RSI, MACD, ADX, volume, and trend analysis, we highlight strong buy, monitor, and strong sell stocks, providing actionable insights for traders and investors alike. Key tickers covered include TLRY, SNDL, CRON, CURLF, JAZZ, INCY, TEVA, VTRS, and others.
Top Cannabis & Pharma Stocks Overview
| Ticker | Current Price | RSI | MACD | ADX | Trend | Signal | Action |
|---|---|---|---|---|---|---|---|
| TLRY | $5.51 | 35.1 | -0.11 | 16.6 | Ranging | Strong Sell | Avoid - Downtrend Active |
| SNDL | $1.43 | 48.6 | 0.00 | 24.8 | Weak | Strong Buy | Entry - Volume Confirms, Poor R:R 0.4:1 |
| CRON | $2.75 | 58.0 | 0.00 | 26.2 | Trending | Strong Buy | Entry - Breakout, R:R 1.3:1 |
| CURLF | $3.99 | 67.2 | 0.05 | 43.6 | Trending | Strong Buy | Entry - Trend Continuation, Tighten Stop |
| JAZZ | $223.61 | 69.8 | 2.07 | 41.6 | Trending | Strong Buy | Entry - Trend Continuation, RSI 70 |
| INCY | $100.32 | 59.2 | 0.31 | 29.1 | Ranging | Strong Buy | Entry - Breakout, Monitor Pullback |
| TEVA | $35.84 | 68.5 | 0.30 | 35.2 | Trending | Strong Buy | Entry - Trend Continuation, Tighten Stop |
| VTRS | $16.92 | 74.6 | 0.25 | 36.5 | Trending | Strong Buy | Take Profit - RSI 75 Overbought |
Quick Insight: Use RSI for overbought/oversold levels, MACD for momentum shifts, and ADX to confirm trend strength before making entries.
Featured Snippet: Buy, Hold, and Sell Summary
- Strong Buy: CRON, CURLF, JAZZ, INCY, TEVA
- Monitor / Wait: SNDL, ACB, CGC, DRUG
- Strong Sell: TLRY, OGI, VNRX, KERN
Tip: Align multi-indicator confirmation (RSI, MACD, ADX, volume) for higher trade confidence.
Technical Indicators Explained
RSI (Relative Strength Index)
Indicates overbought (>70) or oversold (<30) conditions.
Example: VTRS RSI 74.6 → Overbought, consider profit-taking.
MACD (Moving Average Convergence Divergence)
Shows momentum shifts and trend reversals.
Example: CRON MACD 0.00 → Neutral, monitor breakout.
ADX (Average Directional Index)
Measures trend strength. ADX >50 indicates a strong trend.
Example: CURLF ADX 43.6 → Moderate trend, follow continuation.
Volume & OBV
High volume with rising OBV signals strong trend confirmation.
Example: JAZZ volume confirms trend continuation.
Short-Term vs Long-Term Strategy
Short-Term Trading
- Focus on breakout signals, RSI extremes, and volume spikes.
- Example: CRON shows 8.27% intraday gain → breakout entry recommended.
Long-Term Investment
- Use trend continuation signals and cumulative ADX confirmation.
- Example: TEVA demonstrates a stable upward trend - ideal for medium-term hold.
Risk & Reward Management
- Always calculate R:R ratio: entries like SNDL have R:R 0.4:1 (poor).
- Use trailing stops on strong buy stocks (CURLF, JAZZ) to protect gains.
- Avoid strong sell stocks (TLRY, KERN) until trend reversal confirmed.
The 2026 cannabis and pharma sector shows mixed opportunities. Traders should prioritize CRON, CURLF, JAZZ, INCY, TEVA for momentum-based trades, while TLRY, OGI, VNRX remain high-risk avoid zones. Using a multi-indicator strategy combining RSI, MACD, ADX, and volume ensures informed, high-probability trading decisions.
Related Articles

Disclaimer : The above information is for general informational purposes only. All information on the Site is provided in good faith, however we make no representation or warranty of any kind, express or implied, regarding the accuracy, adequacy, validity, reliability, availability or completeness of any information on the Site.