
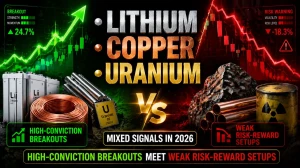
Lithium, Copper & Uranium Stocks Flash Mixed Signals: High-Conviction Breakouts Meet Weak Risk-Reward Setups
Commodity stocks across lithium, copper, uranium, and mining sectors show mixed technical signals with strong breakout momentum in select names and weak risk-reward setups in others. Detailed analysis of trends, indicators, and key stock opportunities for informed market tracking.
by Kowsalya
Published Jun 19, 2026 | Updated Jun 19, 2026 | 📖 3 min read
Article continues below advertisement

Commodity-linked equities across lithium, uranium, copper, and mining sectors are showing a split market structure. Several stocks are generating strong momentum breakout signals, while many others remain range-bound or offer weak risk-reward setups despite “Strong Buy” labels.
Key takeaway: momentum is present, but selective entry is essential due to uneven confirmation across indicators.
Market Overview: What’s Really Happening
1. Strong Breakouts in Industrial Metals and Mining
Stocks linked to copper, steel, infrastructure, and construction materials are showing improving institutional participation. Key signals include rising OBV, bullish MACD trends, and strengthening ADX readings.
Notable stocks in this group include:
- Freeport-McMoRan
- Southern Copper Corporation
- Steel Dynamics
These names indicate accumulation phases, but many are still limited by suboptimal risk-to-reward ratios.
2. Uranium Sector Shows Early Momentum but Choppy Structure
Uranium stocks are improving technically but remain inconsistent. RSI levels are mostly neutral, while volatility is expanding, suggesting early-stage positioning rather than confirmed trend expansion.
Key stocks:
- Cameco Corporation
- Uranium Energy Corp
- NexGen Energy
Overall interpretation: uranium is in a consolidation-to-breakout transition phase.
3. Lithium Sector Remains Weak and Range-Bound
Lithium stocks continue to underperform relative to other commodity segments. Technical indicators show weak trend strength, oversold conditions without reversal confirmation, and persistent bearish structure in several names.
Key stocks:
- Albemarle Corporation
- Lithium Americas
- Sociedad Química y Minera de Chile
Conclusion: lithium is still in a wait-and-watch phase with no confirmed reversal trend.
Featured Snippet: Best Performing Signals
Strong momentum breakout stocks today
- Industrial metals and construction-related equities dominate momentum flows
- Volume confirmation remains the key trigger
- RSI range between 55 and 65 supports sustainable trends
Examples:
- CRH plc
- Martin Marietta Materials
- Vulcan Materials Company
- EMCOR Group, Inc.
Weak and Avoid Zones
Several commodity names remain under pressure due to persistent bearish structure, weak OBV, and lack of momentum confirmation.
Examples:
- Rio Tinto Group
- Vale S.A.
- Glencore plc
These remain in distribution or downtrend phases and are not favorable for new entries.
Technical Insight Summary
Across the dataset, four dominant technical factors define current market behavior:
Trend Strength (ADX)
- Strong setups: ADX 20–35 (healthy trending conditions)
- Weak setups: ADX below 15 (range-bound behavior)
Momentum (MACD)
- Bullish crossovers indicate early entry setups
- Bearish divergence signals continuation risk
RSI Behavior
- Optimal entry zone: 45–65 RSI
- Overbought risk zone: above 70
Risk-to-Reward Filter
Most “Strong Buy” signals still fail to meet ideal risk-reward thresholds, which limits aggressive positioning.
AI Market Interpretation
Despite widespread bullish classifications, the underlying structure shows:
- Institutional accumulation rather than aggressive buying
- Breakouts forming, but requiring pullback entries for better risk control
- Uneven confirmation across momentum and trend indicators
In short, the market is bullish in structure but selective in execution.
- Copper and industrial metals show the strongest momentum structure
- Uranium is in early breakout formation but not fully confirmed
- Lithium remains weak and requires more stabilization
- Risk-reward remains the key limiting factor across most setups
Overall, this is a “selective momentum market” where timing and entry discipline matter more than signal frequency.
Disclaimer: This article is for informational and educational purposes only and should not be considered financial, investment, or trading advice. Stock market investments involve risk, including the possible loss of capital. Readers should conduct their own research or consult a qualified financial advisor before making any investment decisions.
Related Articles


Disclaimer : The above information is for general informational purposes only. All information on the Site is provided in good faith, however we make no representation or warranty of any kind, express or implied, regarding the accuracy, adequacy, validity, reliability, availability or completeness of any information on the Site.