
July 2026: 10 Stocks with Strong Buy Signals & High Confidence
MarketsHost.com's July 2026 scan highlights 10 stocks, including DAL (Score 78) and FVN (100% Confidence), showing strong buy signals and robust technicals.
by Kowsalya
Published Jul 14, 2026 | Updated Jul 14, 2026 | 📖 10 min read
Article continues below advertisement
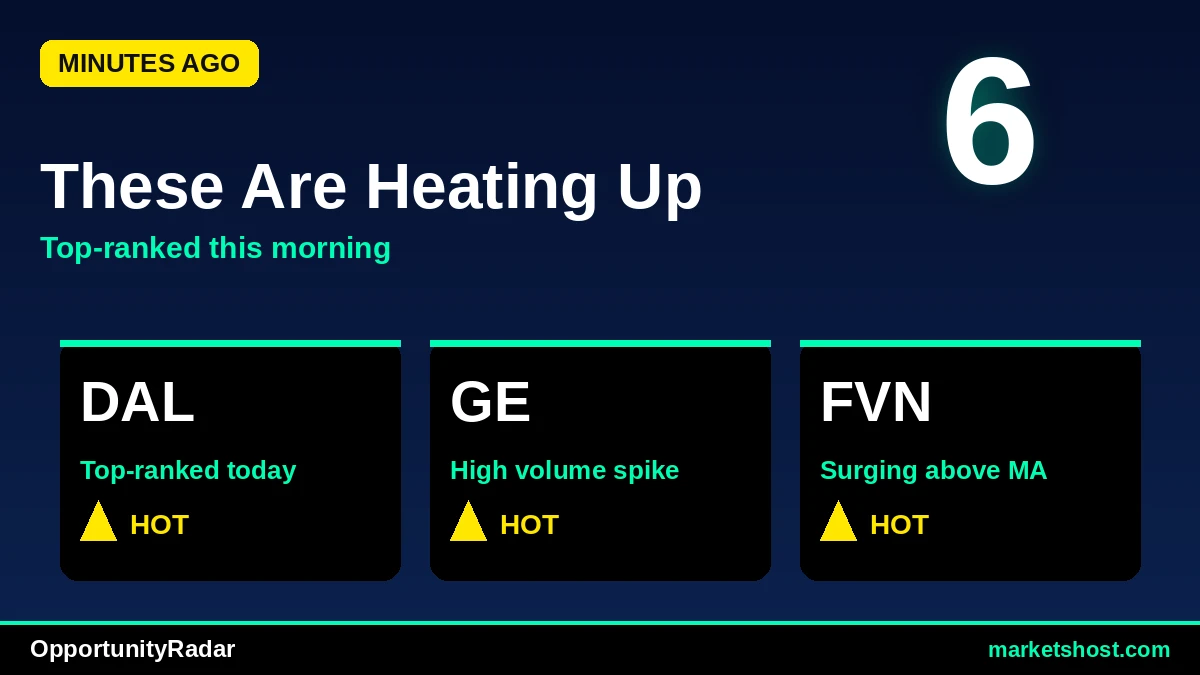
OpportunityRadar Uncovers 10 Strong Buy Signals for July 2026
MarketsHost.com's latest OpportunityRadar scan for July 14, 2026, reveals a compelling set of buy signals across the market, with Delta Air Lines, Inc. (DAL) leading the pack with an impressive OpportunityRadar Score of 78. This strong overall score for DAL is significantly bolstered by an exceptional fundamental rating of 95, indicating a robust underlying assessment by the scanner.
Out of the ten featured tickers, five — Future Vision II Acquisition C (FVN), WD-40 Company (WDFC), Joint Stock Company Kaspi.kz (KSPI), Match Group, Inc. (MTCH), and Chubb Limited (CB) — are flagged with a 100% confidence rating for their buy signals. The scan also shows a balanced technical landscape among these top opportunities, with five tickers exhibiting a MACD BULL signal and five with a MACD BEAR signal. The average Relative Strength Index (RSI) across this group of ten stocks stands at approximately 53.34, suggesting a generally neutral to moderately strong short-term price momentum.
Top 10 Signals at a Glance
| # | Ticker | Company | Price | Score | Confidence | RSI | MACD | 1-Month Return |
|---|---|---|---|---|---|---|---|---|
| 1 | DAL | Delta Air Lines, Inc. | $85.25 | 78 | 83% | 47.9 | BEAR | 2.63% |
| 2 | GE | GE Aerospace | $354.62 | 76 | 83% | 52.2 | BEAR | 5.76% |
| 3 | FVN | Future Vision II Acquisition C | $11.0 | 67 | 100% | 50.3 | BULL | 1.1% |
| 4 | WDFC | WD-40 Company | $248.01 | 65 | 100% | 58.1 | BULL | 11.21% |
| 5 | KSPI | Joint Stock Company Kaspi.kz | $89.9 | 65 | 100% | 57.9 | BULL | 11.59% |
| 6 | VIRT | Virtu Financial, Inc. | $58.9 | 64 | 67% | 47.0 | BEAR | 2.22% |
| 7 | MIDD | The Middleby Corporation | $135.43 | 64 | 67% | 53.4 | BEAR | 6.21% |
| 8 | MTCH | Match Group, Inc. | $38.07 | 64 | 100% | 55.7 | BULL | 9.11% |
| 9 | MCS | Marcus Corporation (The) | $22.19 | 63 | 83% | 51.7 | BEAR | -1.11% |
| 10 | CB | Chubb Limited | $351.33 | 63 | 100% | 59.2 | BULL | 7.07% |
#1: DAL — Delta Air Lines, Inc.
Delta Air Lines, Inc. (DAL) stands out with the highest OpportunityRadar Score in this scan, reaching 78. This strong overall score is significantly bolstered by an exceptional fundamental rating of 95, indicating a robust underlying assessment by the scanner. Despite this, the technical score sits at 66, accompanied by a MACD BEAR signal and an RSI of 47.9, indicating a neutral to slightly bearish short-term momentum. The stock has posted a 1-month return of 2.63% and a robust 3-month return of 18.89%. The BUY signal comes with an 83% confidence and a STRONG ENTRY recommendation, supported by a favorable Risk/Reward ratio of 2.0.
A key observation for DAL is the MACD BEAR signal, which contrasts with its high fundamental score and overall BUY recommendation, suggesting that while the scanner identifies strong long-term prospects, short-term price action might face headwinds. The RSI below 50 further supports this neutral to slightly bearish short-term technical stance.
#2: GE — GE Aerospace
GE Aerospace (GE) presents a compelling profile with an OpportunityRadar Score of 76, ranking second on this list. The company's fundamental rating is strong at 85, complementing a technical score of 70. The stock is currently priced at $354.62 and is flagged with a BUY signal, carrying an 83% confidence level and a STRONG ENTRY recommendation. Its RSI is 52.2, indicating a neutral to slightly bullish momentum, but the MACD is in BEAR territory. Over the past month, GE has delivered a 5.76% return, with a 3-month return of 11.52%. The Risk/Reward ratio for GE is 1.6.
The MACD BEAR signal for GE Aerospace, despite a solid overall score and positive 1-month and 3-month returns, suggests a potential divergence where recent price action may be experiencing some bearish pressure. This technical indicator warrants attention for investors considering the 83% confidence BUY signal and a moderate 1.6 Risk/Reward ratio.
#3: FVN — Future Vision II Acquisition C
Future Vision II Acquisition C (FVN) is a standout with a STRONG BUY signal, the only one among the top ten, and a perfect 100% confidence rating. Its OpportunityRadar Score is 67, driven primarily by a strong technical score of 80, while its fundamental rating is 47. The stock trades at $11.0, with an RSI of 50.3, indicating a neutral momentum, and a MACD BULL signal, suggesting positive short-term price action. Despite the strong buy indicators, FVN has seen modest returns, with a 1-month gain of 1.1% and a 3-month gain of 2.33%. The Risk/Reward ratio is noted at 1.8.
The primary risk factor for FVN lies in its low fundamental score of 47 and relatively subdued 1-month and 3-month returns, which appear to be at odds with the STRONG BUY signal and 100% confidence. This divergence between strong technicals and lower fundamental strength, coupled with modest recent performance, suggests that the opportunity might be driven purely by short-term technical patterns rather than underlying business strength.
#4: WDFC — WD-40 Company
WD-40 Company (WDFC) registers an OpportunityRadar Score of 65 with a BUY signal and a robust 100% confidence rating, indicating a high conviction from the scanner. Its technical score is 73, while fundamentals stand at 53. Currently priced at $248.01, WDFC exhibits an RSI of 58.1, suggesting a strong upward momentum, and a MACD BULL signal, reinforcing the positive technical outlook. The stock has demonstrated impressive recent performance, with a 1-month return of 11.21% and an even stronger 3-month return of 21.12%. The Risk/Reward ratio is favorable at 2.0.
While WDFC shows strong technicals and high confidence, its RSI of 58.1 is approaching the 60-70 range, which can sometimes precede a consolidation or minor pullback if momentum becomes overextended. Investors should monitor this level, even with the positive MACD BULL signal and strong recent returns.
#5: KSPI — Joint Stock Company Kaspi.kz
Joint Stock Company Kaspi.kz (KSPI) also receives a BUY signal with 100% confidence, achieving an OpportunityRadar Score of 65. Its technical score is 71, supported by a fundamental score of 55. Trading at $89.9, KSPI's RSI is 57.9, indicating healthy upward momentum, and its MACD is in BULL territory, signaling positive short-term price trends. The stock has delivered a strong 1-month return of 11.59% and a 3-month return of 9.18%. However, a notable aspect of its profile is a low Risk/Reward ratio of 0.2.
The most significant risk for KSPI, despite its 100% confidence BUY signal and positive technicals, is its extremely low Risk/Reward ratio of 0.2. This metric implies that the potential reward from this opportunity is significantly smaller than the potential risk involved, a crucial consideration for any investment decision, regardless of the strong confidence rating.
#6: VIRT — Virtu Financial, Inc.
Virtu Financial, Inc. (VIRT) is highlighted with an OpportunityRadar Score of 64, a BUY signal, and a 67% confidence rating, which is lower than many other entries on this list. Its technical score is 68, and its fundamental score is 58. Priced at $58.9, VIRT's RSI is 47.0, suggesting neutral to slightly bearish momentum, and its MACD is in BEAR territory. The stock has seen a 1-month return of 2.22% and a substantial 3-month return of 14.86%. The Risk/Reward ratio for VIRT is 2.0.
The lower confidence rating of 67% and the MACD BEAR signal for VIRT suggest that the scanner's bullish outlook is less confirmed compared to opportunities with 100% confidence. The RSI of 47.0 also indicates that short-term momentum is not strongly bullish, which could be a factor for investors looking for more robust technical alignment.
#7: MIDD — The Middleby Corporation
The Middleby Corporation (MIDD) also holds an OpportunityRadar Score of 64, with a BUY signal and a 67% confidence rating, similar to VIRT. Its technical score is 69, and its fundamental score is 56. Trading at $135.43, MIDD's RSI is 53.4, indicating a neutral to slightly positive momentum, but its MACD is in BEAR territory. The company has posted a 1-month return of 6.21% and a strong 3-month return of 17.79%. The Risk/Reward ratio is 1.6.
For MIDD, the combination of a 67% confidence rating and a MACD BEAR signal suggests that while the stock has delivered solid 3-month returns, the immediate technical momentum might be facing headwinds. The moderate Risk/Reward ratio of 1.6 also indicates a balanced but not exceptionally favorable risk-return profile, warranting careful consideration.
#8: MTCH — Match Group, Inc.
Match Group, Inc. (MTCH) is featured with an OpportunityRadar Score of 64, a BUY signal, and a high 100% confidence rating. Its technical score is 69, with a fundamental score of 56. Priced at $38.07, MTCH's RSI is 55.7, indicating a healthy upward momentum, and its MACD is in BULL territory, reinforcing positive short-term trends. The stock has achieved a 1-month return of 9.11% and a 3-month return of 13.34%. However, it carries a low Risk/Reward ratio of 0.4.
Despite the strong 100% confidence and positive technical indicators like MACD BULL and a healthy RSI, the low Risk/Reward ratio of 0.4 for MTCH is a critical factor. This suggests that the potential upside may not be proportional to the inherent risks, which could be a concern for investors prioritizing risk management.
#9: MCS — Marcus Corporation (The)
Marcus Corporation (The) (MCS) enters the list with an OpportunityRadar Score of 63, a BUY signal, and an 83% confidence rating. Its technical score is 69, while its fundamental score is 53. Currently trading at $22.19, MCS has an RSI of 51.7, indicating neutral momentum, but its MACD is in BEAR territory. Notably, the stock has experienced a 1-month return of -1.11%, contrasting with a strong 3-month return of 14.44%. The Risk/Reward ratio is favorable at 2.0.
A significant point of consideration for MCS is its negative 1-month return of -1.11%, which stands in contrast to its overall BUY signal and 83% confidence. This recent price depreciation, coupled with a MACD BEAR signal, indicates that despite a strong 3-month performance, the immediate short-term trend has been unfavorable, requiring closer monitoring.
#10: CB — Chubb Limited
Chubb Limited (CB) rounds out our top ten with an OpportunityRadar Score of 63, a BUY signal, and a perfect 100% confidence rating. Its technical score is 69, with a fundamental score of 55. Priced at $351.33, CB's RSI is 59.2, indicating strong upward momentum, and its MACD is in BULL territory, signaling positive short-term price action. The stock has delivered a 1-month return of 7.07% and a 3-month return of 7.86%. Similar to some other high-confidence picks, it has a low Risk/Reward ratio of 0.4.
Despite the 100% confidence and strong technicals like a MACD BULL signal and an RSI nearing 60, the Risk/Reward ratio of 0.4 for Chubb Limited is a key risk factor. This low ratio suggests that the potential for gain might not adequately compensate for the potential risks, which is an important consideration for investors even with strong conviction signals.
Key Observations Across the Scan
Among the top ten tickers identified by the OpportunityRadar scan for July 14, 2026, several patterns emerge. Exactly five tickers — FVN, WDFC, KSPI, MTCH, and CB — are flagged with a 100% confidence rating, indicating the scanner's highest conviction. An equal number of tickers, five, also display a MACD BULL signal, suggesting positive short-term momentum for half of the list. The average RSI across these ten opportunities is approximately 53.34, pointing to generally neutral to moderately bullish short-term price action. Two tickers, WD-40 Company (WDFC) and Joint Stock Company Kaspi.kz (KSPI), have delivered strong 1-month returns exceeding 10%, at 11.21% and 11.59% respectively. Furthermore, three tickers — Delta Air Lines, Inc. (DAL), WD-40 Company (WDFC), and The Middleby Corporation (MIDD) — have shown robust 3-month returns greater than 15%, with DAL at 18.89%, WDFC at 21.12%, and MIDD at 17.79%. Four tickers, DAL, WDFC, VIRT, and MCS, boast a favorable Risk/Reward ratio of 2.0.
Key Risk Factors
- MACD Divergence with Buy Signals: A notable risk factor across several tickers is the presence of a MACD BEAR signal despite an overall BUY signal. Delta Air Lines, Inc. (DAL), GE Aerospace (GE), Virtu Financial, Inc. (VIRT), The Middleby Corporation (MIDD), and Marcus Corporation (MCS) all exhibit this characteristic. For instance, DAL, with its high OpportunityRadar Score of 78, still shows a MACD BEAR, suggesting potential short-term bearish pressure that warrants close monitoring.
- Low Risk/Reward Ratios: Three tickers among the top ten, Joint Stock Company Kaspi.kz (KSPI) with 0.2, Match Group, Inc. (MTCH) with 0.4, and Chubb Limited (CB) with 0.4, present significantly low Risk/Reward ratios. These figures indicate that the potential upside from these opportunities may not adequately compensate for the inherent downside risk, which is a critical consideration for investors focused on risk management.
- Recent Price Underperformance: Marcus Corporation (MCS) stands out with a negative 1-month return of -1.11%. This recent price depreciation contrasts with its 83% confidence BUY signal and strong 3-month performance, suggesting that while the longer-term outlook might be positive, the immediate trend has been unfavorable and could indicate ongoing selling pressure.
About Our Methodology
OpportunityRadar scans 6,600+ US stocks daily using 15+ technical indicators including RSI, MACD, Bollinger Bands, ADX, Aroon, support/resistance levels, and volume analysis, combined with fundamental metrics. Stocks are scored 0-100 with signals ranging from Accumulate to Strong Buy. Entry confidence is rated 50-100% based on 6 confirmation factors.
Disclaimer: This article is for informational purposes only and does not constitute financial advice. Past performance does not guarantee future results. Always conduct your own research and consult a qualified financial advisor before making investment decisions. Data as of July 14, 2026.
Related Articles




Disclaimer : The above information is for general informational purposes only. All information on the Site is provided in good faith, however we make no representation or warranty of any kind, express or implied, regarding the accuracy, adequacy, validity, reliability, availability or completeness of any information on the Site.