10 Strong Buy Signals Emerge in June 2026 Stock Scan
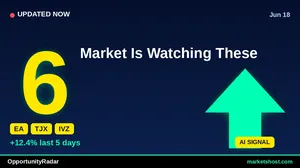
MarketsHost.com's June 2026 scan reveals 10 stocks with 'STRONG ENTRY' BUY signals, including EA and TJX at a 66 OpportunityRadar Score, and HPE with 117.82% 3-month returns.
by Kowsalya
Published Jun 18, 2026 | Updated Jun 18, 2026 | 📖 10 min read
Article continues below advertisement

OpportunityRadar Uncovers 10 Strong Buy Signals for June 2026
As of June 18, 2026, the MarketsHost.com OpportunityRadar scan has identified a compelling set of 10 stocks exhibiting 'STRONG ENTRY' BUY signals. Leading the pack with an impressive OpportunityRadar Score of 66 are Electronic Arts Inc. (EA) at $203.29 and The TJX Companies, Inc. (TJX) at $165.38. Both tickers show robust technical scores of 71 and fundamental scores of 58, underpinned by 100% confidence ratings and MACD BULL signals, indicating potential for continued upward movement.
The current scan highlights a broad consensus among the top signals, with 8 out of the 10 profiled tickers boasting a 100% confidence rating for their 'BUY' signal. Across this selection, the average Relative Strength Index (RSI) hovers around 59.9, suggesting healthy momentum without being in deeply overbought territory. Furthermore, a significant majority—9 out of the 10 tickers—are displaying a MACD BULL signal, reinforcing the positive technical outlook. All 10 identified opportunities are flagged with a 'STRONG ENTRY' recommendation, signaling a favorable confluence of factors for potential investors.
Top 10 Signals at a Glance
| # | Ticker | Company | Price | Score | Confidence | RSI | MACD | 1-Month Return |
|---|---|---|---|---|---|---|---|---|
| 1 | EA | Electronic Arts Inc. | $203.29 | 66 | 100% | 59.9 | BULL | 0.84% |
| 2 | TJX | TJX Companies, Inc. (The) | $165.38 | 66 | 100% | 60.8 | BULL | 3.88% |
| 3 | IVZ | Invesco Ltd | $28.47 | 65 | 100% | 56.1 | BULL | 5.50% |
| 4 | HPE | Hewlett Packard Enterprise Com | $47.24 | 65 | 83% | 59.8 | BEAR | 39.78% |
| 5 | MTB | M&T Bank Corporation | $226.18 | 64 | 100% | 58.8 | BULL | 7.49% |
| 6 | PNC | PNC Financial Services Group, | $233.04 | 64 | 100% | 60.1 | BULL | 7.48% |
| 7 | FLG | Flagstar Bank, N.A. | $14.61 | 64 | 100% | 57.5 | BULL | 6.88% |
| 8 | HBT | HBT Financial, Inc. | $30.06 | 63 | 100% | 60.0 | BULL | 6.71% |
| 9 | UVSP | Univest Financial Corporation | $41.76 | 63 | 100% | 64.1 | BULL | 7.06% |
| 10 | PPG | PPG Industries, Inc. | $119.24 | 63 | 100% | 60.3 | BULL | 14.22% |
#1: EA — Electronic Arts Inc.
Electronic Arts Inc. (EA) registers an OpportunityRadar Score of 66, placing it at the top of today's scan. This score is supported by a technical component of 71 and a fundamental component of 58. The signal is a 'BUY' with a 100% confidence rating and a 'STRONG ENTRY' recommendation. Technical indicators show an RSI of 59.9 and a MACD in BULL territory, suggesting positive momentum. Over the past month, EA has seen a 0.84% return, with a 1.38% return over three months. The Risk/Reward ratio for EA stands at 2.0.
While the overall signal for EA is strong, its 1-month return of 0.84% is modest compared to some other tickers on the list, despite the 100% confidence rating. This could indicate a more measured upward trajectory in the immediate term, or that recent gains have been consolidated. Investors should consider this against the 2.0 Risk/Reward ratio.
#2: TJX — TJX Companies, Inc. (The)
The TJX Companies, Inc. (TJX) also garners an OpportunityRadar Score of 66, mirroring EA's top position. Its technical score is 71, with a fundamental score of 58. The 'BUY' signal comes with a 100% confidence and a 'STRONG ENTRY' designation. TJX's technical profile includes an RSI of 60.8 and a MACD indicating a BULL trend. The stock has posted a 3.88% return over the last month and an even more significant 6.71% return over the past three months, demonstrating consistent upward movement.
A notable aspect of TJX's profile is its relatively low Risk/Reward ratio of 0.3. While the technical indicators and confidence are robust, this low ratio suggests that the potential upside may be limited relative to the defined stop-loss level, as assessed by the OpportunityRadar system. This is a point of consideration for risk-averse investors.
#3: IVZ — Invesco Ltd
Invesco Ltd (IVZ) shows a strong OpportunityRadar Score of 65, driven by a technical score of 71 and a fundamental score of 55. The scanner has issued a 'BUY' signal with 100% confidence and a 'STRONG ENTRY' recommendation. IVZ's RSI is 56.1, and its MACD is in BULL territory, both indicative of a healthy uptrend. The stock has delivered a 5.5% return in the last month and an impressive 22.64% return over the three-month period, highlighting significant recent price appreciation.
Despite the strong performance and high confidence, IVZ's Risk/Reward ratio is 0.6. This suggests that while the stock has shown considerable gains, the potential reward for new entry, relative to the defined risk, is moderate. This might warrant closer examination for those prioritizing higher Risk/Reward profiles.
#4: HPE — Hewlett Packard Enterprise Com
Hewlett Packard Enterprise Com (HPE) is flagged with an OpportunityRadar Score of 65, comprising a technical score of 69 and a fundamental score of 58. The signal is a 'BUY', but with a slightly lower confidence rating of 83% compared to the 100% seen in other top picks. It still receives a 'STRONG ENTRY' recommendation. HPE's RSI is 59.8, but notably, its MACD is in BEAR territory, which is a divergence from the 'BUY' signal. The stock has experienced exceptional returns, with a 39.78% gain in the last month and a remarkable 117.82% gain over the past three months. The Risk/Reward ratio is 2.0.
The MACD BEAR signal for HPE, despite the 'BUY' recommendation and significant recent returns, represents a key risk factor. This divergence between the momentum indicator and the overall signal confidence of 83% suggests underlying cautionary technical dynamics that warrant careful monitoring. The high short-term returns could also imply a degree of extended price action.
#5: MTB — M&T Bank Corporation
M&T Bank Corporation (MTB) has an OpportunityRadar Score of 64, with a technical score of 68 and a fundamental score of 58. The scanner indicates a 'BUY' signal with 100% confidence and a 'STRONG ENTRY'. MTB's technical indicators show an RSI of 58.8 and a MACD in BULL territory, supporting the positive outlook. The stock has performed well, returning 7.49% over the past month and 14.15% over the last three months, showing steady growth.
A point of consideration for MTB is its Risk/Reward ratio of 0.3. This low ratio suggests that the potential profit relative to the risk taken, as defined by the OpportunityRadar system, is limited. While the confidence and technical signals are strong, the constrained Risk/Reward ratio might deter investors seeking higher leverage on their positions.
#6: PNC — PNC Financial Services Group,
PNC Financial Services Group (PNC) also scores a 64 on the OpportunityRadar, with a technical score of 68 and a fundamental score of 58. It carries a 'BUY' signal with 100% confidence and a 'STRONG ENTRY' recommendation. Technicals for PNC include an RSI of 60.1 and a MACD that is currently BULL. The stock has delivered a 7.48% return in the last month and a 15.53% return over the past three months, indicating consistent upward momentum.
Similar to MTB, PNC presents a low Risk/Reward ratio of 0.3. This metric, while not negating the strong buy signal and 100% confidence, implies that the potential for gain relative to the risk of loss is on the lower side. Investors should weigh this factor against the positive technical and confidence readings when evaluating the opportunity.
#7: FLG — Flagstar Bank, N.A.
Flagstar Bank, N.A. (FLG) registers an OpportunityRadar Score of 64, with a technical score of 69 and a fundamental score of 56. The scanner has generated a 'BUY' signal with 100% confidence and a 'STRONG ENTRY' recommendation. FLG's technical profile includes an RSI of 57.5 and a MACD in BULL territory, both supporting a positive trend. The stock has seen a 6.88% return over the past month and an 18.97% return over the last three months, reflecting solid performance.
The Risk/Reward ratio for FLG is 0.6. While this is a positive signal, it is on the lower end compared to some other high-confidence 'BUY' signals on the list. This suggests that the potential reward for taking a position might be moderate relative to the identified risk, a factor that investors should consider in their decision-making process.
#8: HBT — HBT Financial, Inc.
HBT Financial, Inc. (HBT) is identified with an OpportunityRadar Score of 63, consisting of a technical score of 69 and a fundamental score of 53. The signal is a 'BUY' with 100% confidence and a 'STRONG ENTRY' designation. HBT's technical indicators show an RSI of 60.0 and a MACD in BULL territory. The stock has provided a 6.71% return over the past month and a 14.69% return over the last three months, demonstrating steady upward price action.
HBT's Risk/Reward ratio is 0.3, indicating that the potential for profit, relative to the defined stop-loss, is limited. Despite the strong technical signals and perfect confidence rating, this low Risk/Reward ratio suggests that the trade setup might offer less asymmetric upside compared to higher-ratio opportunities. This is a critical factor for risk management.
#9: UVSP — Univest Financial Corporation
Univest Financial Corporation (UVSP) holds an OpportunityRadar Score of 63, with a technical score of 69 and a fundamental score of 53. The scanner indicates a 'BUY' signal with 100% confidence and a 'STRONG ENTRY'. UVSP's technical profile shows an RSI of 64.1 and a MACD in BULL territory. The stock has delivered a 7.06% return over the last month and a significant 26.72% return over the past three months, reflecting strong recent performance.
With an RSI of 64.1, UVSP is approaching the upper bound of the typical range for healthy momentum, nearing levels that might indicate it is becoming overbought in the short term. While not yet in extreme territory, this high RSI, combined with a 0.4 Risk/Reward ratio, suggests that while the trend is strong, the immediate upside might be somewhat compressed relative to the risk.
#10: PPG — PPG Industries, Inc.
PPG Industries, Inc. (PPG) rounds out the top 10 with an OpportunityRadar Score of 63, featuring a technical score of 66 and a fundamental score of 58. The signal is a 'BUY' with 100% confidence and a 'STRONG ENTRY' recommendation. PPG's technicals include an RSI of 60.3 and a MACD in BULL territory. The stock has shown strong recent performance, with a 14.22% return over the last month and a 22.64% return over the past three months.
PPG's Risk/Reward ratio is 0.4. While the stock demonstrates robust technicals and strong recent returns, this ratio suggests that the potential reward might be somewhat constrained relative to the risk. Investors should consider this when evaluating the entry point, despite the high confidence and positive momentum indicators.
Key Observations Across the Scan
- All 10 profiled tickers have received a 'STRONG ENTRY' recommendation, indicating a favorable setup across the board.
- A significant majority, 8 out of the 10 tickers, are backed by a 100% confidence rating, suggesting high conviction from the OpportunityRadar system.
- 9 out of 10 tickers display a MACD BULL signal, reinforcing a generally positive momentum trend among these selections. Only HPE shows a MACD BEAR signal.
- The average RSI across these 10 tickers is approximately 59.9, indicating healthy momentum without being in an overextended or overbought state.
- Hewlett Packard Enterprise (HPE) stands out with exceptional 3-month returns of 117.82% and 1-month returns of 39.78%, demonstrating significant recent price appreciation.
- Several tickers, including IVZ (22.64%), HPE (117.82%), UVSP (26.72%), and PPG (22.64%), have posted strong 3-month returns exceeding 20%.
Key Risk Factors
- MACD Divergence in HPE: Hewlett Packard Enterprise (HPE) presents a 'BUY' signal with an 83% confidence rating, yet its MACD is in BEAR territory. This divergence between the signal and a key momentum indicator warrants close observation, as it could suggest underlying weakening in the trend despite recent strong price action.
- Low Risk/Reward Ratios: Several tickers, including TJX (0.3), MTB (0.3), PNC (0.3), HBT (0.3), PPG (0.4), and FLG (0.6), exhibit relatively low Risk/Reward ratios. This indicates that the potential upside, as defined by the OpportunityRadar system's targets versus stop-loss, may be limited compared to the risk involved.
- Elevated RSI for UVSP: Univest Financial Corporation (UVSP) has an RSI of 64.1. While not yet in overbought territory (typically above 70), this higher RSI suggests that the stock has experienced significant short-term buying pressure and could be nearing levels where a temporary pullback or consolidation might occur.
About Our Methodology
OpportunityRadar scans 6,600+ US stocks daily using 15+ technical indicators including RSI, MACD, Bollinger Bands, ADX, Aroon, support/resistance levels, and volume analysis, combined with fundamental metrics. Stocks are scored 0-100 with signals ranging from Accumulate to Strong Buy. Entry confidence is rated 50-100% based on 6 confirmation factors.
Disclaimer: This article is for informational purposes only and does not constitute financial advice. Past performance does not guarantee future results. Always conduct your own research and consult a qualified financial advisor before making investment decisions. Data as of June 18, 2026.
Related Articles

Disclaimer : The above information is for general informational purposes only. All information on the Site is provided in good faith, however we make no representation or warranty of any kind, express or implied, regarding the accuracy, adequacy, validity, reliability, availability or completeness of any information on the Site.