10 Stocks with Strong Buy Signals & High Confidence — June 2026
Explore 10 stocks flashing Strong Entry BUY signals with up to 100% confidence, including Citigroup (C) and JPMorgan (JPM). Data as of June 26, 2026.
by Kowsalya
Published Jun 26, 2026 | Updated Jun 26, 2026 | 📖 10 min read
Article continues below advertisement

OpportunityRadar Highlights 10 Stocks with Strong Buy Signals and High Confidence
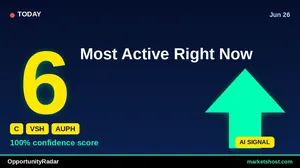
As of June 26, 2026, the OpportunityRadar scanner has identified a compelling set of stocks flashing Strong Entry BUY signals, with several achieving a perfect 100% confidence rating. Leading this selection is Citigroup, Inc. (C), which boasts the highest overall OpportunityRadar Score of 66 among the top contenders, underpinned by a robust fundamental score of 70 and a technical score of 64. JPMorgan Chase & Co. (JPM) also stands out with a 100% confidence BUY signal, supported by a strong fundamental score of 65.
A deeper dive into today's scan reveals a predominantly bullish landscape among these top-ranked opportunities. Out of the first ten tickers identified, seven exhibit a 100% confidence rating for their BUY signals, indicating a high degree of alignment across various confirmation factors. The average Relative Strength Index (RSI) across these ten stocks sits at 59.67, suggesting healthy momentum without being broadly overbought. Furthermore, a significant nine out of the ten tickers display a MACD in BULL territory, reinforcing the positive technical outlook for the majority of these Strong Entry candidates.
Top 10 Signals at a Glance
| # | Ticker | Company | Price | Score | Confidence | RSI | MACD | 1-Month Return |
|---|---|---|---|---|---|---|---|---|
| 1 | C | Citigroup, Inc. | $143.22 | 66 | 83% | 64.9 | BULL | 14.87% |
| 2 | VSH | Vishay Intertechnology, Inc. | $55.98 | 64 | 83% | 52.3 | BEAR | 7.16% |
| 3 | AUPH | Aurinia Pharmaceuticals Inc | $17.30 | 64 | 100% | 59.3 | BULL | 12.70% |
| 4 | PEB | Pebblebrook Hotel Trust | $18.98 | 64 | 100% | 69.1 | BULL | 22.06% |
| 5 | OPY | Oppenheimer Holdings, Inc. | $104.83 | 63 | 100% | 54.6 | BULL | 15.04% |
| 6 | LECO | Lincoln Electric Holdings, Inc | $269.82 | 63 | 100% | 53.9 | BULL | 4.20% |
| 7 | LQDT | Liquidity Services, Inc. | $38.63 | 63 | 100% | 61.7 | BULL | 6.33% |
| 8 | TDY | Teledyne Technologies Incorpor | $630.92 | 63 | 83% | 54.6 | BULL | -0.50% |
| 9 | UMC | United Microelectronics Corpor | $25.38 | 63 | 100% | 61.2 | BULL | 11.90% |
| 10 | JPM | JP Morgan Chase & Co. | $333.18 | 63 | 100% | 65.1 | BULL | 12.28% |
#1: C — Citigroup, Inc.
Citigroup, Inc. (C) registers the highest OpportunityRadar Score in this scan at 66, driven by a strong fundamental score of 70 and a technical score of 64. The stock is currently priced at $143.22 and is flashing a BUY signal with an 83% confidence rating, categorized as a STRONG ENTRY. Technical indicators show an RSI of 64.9, positioning it below the traditional overbought threshold, while the MACD is firmly in BULL territory, suggesting positive momentum. Recent performance highlights include a 1-month return of 14.87% and a 3-month return of 33.38%, indicating significant upward price action in the near term.
Despite the strong overall score and robust returns, the Risk/Reward ratio for Citigroup stands at 0.3. This low figure suggests that for every unit of potential reward, there is a significantly larger unit of potential risk, which could be a point of consideration for investors evaluating the entry point relative to potential downside.
#2: VSH — Vishay Intertechnology, Inc.
Vishay Intertechnology, Inc. (VSH) presents an OpportunityRadar Score of 64, characterized by a strong technical score of 71, though its fundamental score is lower at 53. The stock, priced at $55.98, has generated a BUY signal with an 83% confidence and is marked as a STRONG ENTRY. A notable aspect of VSH's recent performance is its exceptional 3-month return of 228.91%, alongside a 1-month return of 7.16%. The RSI is at 52.3, indicating neutral to slightly bullish momentum.
A key technical divergence for VSH is that its MACD is in BEAR territory, despite the overall BUY signal and Strong Entry rating. This conflicting MACD reading, alongside a strong technical score, suggests that while other technical factors may be aligned for a BUY, the momentum indicator points to a bearish crossover, which warrants careful monitoring.
#3: AUPH — Aurinia Pharmaceuticals Inc
Aurinia Pharmaceuticals Inc (AUPH) shows an OpportunityRadar Score of 64, with its technical component scoring 69 and fundamentals at 56. The stock is currently trading at $17.30 and has triggered a BUY signal with a perfect 100% confidence rating, designating it as a STRONG ENTRY. Technical analysis reveals an RSI of 59.3 and a MACD in BULL territory, indicating positive momentum and trend strength. The company has delivered a 1-month return of 12.7% and a 3-month return of 21.23%.
While the 100% confidence signal is compelling, the Risk/Reward ratio for AUPH is 1.1. This ratio, while positive, suggests that the potential reward is only slightly greater than the potential risk, which might be less attractive compared to opportunities with higher Risk/Reward profiles.
#4: PEB — Pebblebrook Hotel Trust
Pebblebrook Hotel Trust (PEB) also registers an OpportunityRadar Score of 64, driven by a technical score of 69 and a fundamental score of 56. Trading at $18.98, PEB has received a BUY signal with a 100% confidence rating, indicating a STRONG ENTRY. The stock's technical posture includes an RSI of 69.1 and a MACD in BULL territory, signaling robust upward momentum. PEB has demonstrated strong recent performance, with a 1-month return of 22.06% and a 3-month return of 54.81%.
A notable point of caution for PEB is its RSI of 69.1, which is very close to the traditional 70 threshold for overbought conditions. This elevated RSI suggests that the stock's recent strong upward movement might be nearing a point where it could experience a pullback. Additionally, the Risk/Reward ratio stands at a low 0.3, indicating a higher risk relative to potential reward.
#5: OPY — Oppenheimer Holdings, Inc.
Oppenheimer Holdings, Inc. (OPY) is featured with an OpportunityRadar Score of 63, supported by a technical score of 69 and a fundamental score of 53. The stock is priced at $104.83 and carries a BUY signal with a 100% confidence rating, marking it as a STRONG ENTRY. Technical indicators show an RSI of 54.6, suggesting healthy but not overextended momentum, and its MACD is in BULL territory. OPY has seen a 1-month return of 15.04% and a 3-month return of 19.87%.
The Risk/Reward ratio for OPY is 0.9. This figure, being below 1.0, implies that the potential risk associated with the trade might be slightly higher than the potential reward, which could be a factor for investors prioritizing a more favorable risk-to-return profile.
#6: LECO — Lincoln Electric Holdings, Inc
Lincoln Electric Holdings, Inc (LECO) registers an OpportunityRadar Score of 63, with a technical score of 66 and a fundamental score of 58. Currently trading at $269.82, LECO has generated a BUY signal with a 100% confidence rating and is designated as a STRONG ENTRY. The technical picture for LECO includes an RSI of 53.9 and a MACD in BULL territory, suggesting a stable positive trend. However, its recent returns are more modest, with a 1-month return of 4.2% and a 3-month return of 8.8%.
The combination of a low Risk/Reward ratio of 0.4 and relatively subdued recent returns (4.2% over 1 month, 8.8% over 3 months) compared to other high-confidence signals suggests that while the entry confidence is high, the immediate upside potential or the risk-adjusted return might be less pronounced than other opportunities in the scan.
#7: LQDT — Liquidity Services, Inc.
Liquidity Services, Inc. (LQDT) holds an OpportunityRadar Score of 63, driven by a technical score of 69 and a fundamental score of 53. The stock, priced at $38.63, has received a BUY signal with a 100% confidence rating and is deemed a STRONG ENTRY. Technical analysis shows an RSI of 61.7 and a MACD in BULL territory, indicating solid upward momentum. LQDT has posted a 1-month return of 6.33% and a robust 3-month return of 30.99%.
Despite the strong confidence and positive technicals, LQDT's Risk/Reward ratio is 0.3. This low ratio suggests that the potential downside risk is considerably higher than the potential upside reward, which is a critical factor to consider when evaluating new positions.
#8: TDY — Teledyne Technologies Incorpor
Teledyne Technologies Incorpor (TDY) shows an OpportunityRadar Score of 63, with technicals at 66 and fundamentals at 58. Trading at $630.92, TDY has a BUY signal with an 83% confidence rating and is marked as a STRONG ENTRY. Technical indicators include an RSI of 54.6 and a MACD in BULL territory, pointing to a positive trend. Notably, TDY has the highest Risk/Reward ratio among the top 10 at 2.0, indicating a favorable balance between potential reward and risk.
A significant point of concern for TDY is its 1-month return, which stands at -0.5%. Despite the BUY signal, Strong Entry, and favorable Risk/Reward, the negative short-term performance suggests recent price weakness that diverges from the bullish signal and warrants careful consideration.
#9: UMC — United Microelectronics Corpor
United Microelectronics Corpor (UMC) registers an OpportunityRadar Score of 63, with a technical score of 68 and a fundamental score of 55. Priced at $25.38, UMC has a BUY signal with a 100% confidence rating, qualifying it as a STRONG ENTRY. Technical indicators show an RSI of 61.2 and a MACD in BULL territory. The stock has demonstrated impressive recent performance, with a 1-month return of 11.9% and an exceptional 3-month return of 186.13%.
While UMC exhibits strong momentum and a 100% confidence rating, its fundamental score of 55 is relatively lower than its technical score of 68. This disparity suggests that while short-term price action and technical indicators are very strong, the underlying fundamental strength, as measured by OpportunityRadar, is less pronounced.
#10: JPM — JP Morgan Chase & Co.
JP Morgan Chase & Co. (JPM) completes our top 10 list with an OpportunityRadar Score of 63, featuring a robust fundamental score of 65 and a technical score of 62. Trading at $333.18, JPM has received a BUY signal with a 100% confidence rating, indicating a STRONG ENTRY. The stock's technical profile includes an RSI of 65.1 and a MACD in BULL territory, suggesting healthy upward momentum. JPM has delivered solid recent returns, with a 1-month return of 12.28% and a 3-month return of 17.8%.
Despite the high confidence and strong fundamental backing, JPM's Risk/Reward ratio is 0.3. This low ratio indicates that the potential reward may not adequately compensate for the inherent risk, a factor that investors typically weigh when considering new positions.
Key Observations Across the Scan
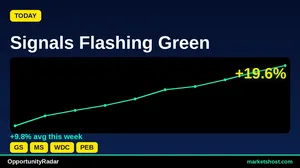
Analyzing the initial ten tickers identified by OpportunityRadar on June 26, 2026, several patterns emerge. A significant majority, seven out of ten, exhibit a perfect 100% confidence rating for their BUY signals, underscoring strong conviction from the scanning algorithm. Furthermore, a highly bullish trend is observed in the MACD indicator, with nine out of the ten tickers showing their MACD in BULL territory. The average RSI across these ten stocks is 59.67, indicating that most are in a healthy momentum zone, not yet overextended. Six of these tickers have delivered a 1-month return exceeding 10%, highlighting recent positive price action. Additionally, five tickers have shown substantial 3-month returns greater than 20%, with Vishay Intertechnology (VSH) and United Microelectronics Corporation (UMC) notably exhibiting 3-month returns of 228.91% and 186.13% respectively.
Key Risk Factors
While the scan identifies numerous Strong Entry BUY signals, several risk factors are visible within the data that warrant attention. First, Vishay Intertechnology, Inc. (VSH), despite its BUY signal and Strong Entry rating, shows its MACD in BEAR territory, creating a divergence that suggests underlying bearish momentum not aligned with the overall signal. Second, Pebblebrook Hotel Trust (PEB) has an RSI of 69.1, which is very close to the 70 threshold, indicating it may be nearing overbought conditions and could be susceptible to a pullback. Finally, a recurring theme among several high-scoring stocks, including Citigroup (C), Pebblebrook Hotel Trust (PEB), Liquidity Services (LQDT), and JP Morgan Chase & Co. (JPM), is a low Risk/Reward ratio of 0.3 or 0.4. This suggests that for these particular opportunities, the potential downside risk significantly outweighs the potential upside reward, which is a crucial consideration for risk-averse investors.
About Our Methodology
OpportunityRadar scans 6,600+ US stocks daily using 15+ technical indicators including RSI, MACD, Bollinger Bands, ADX, Aroon, support/resistance levels, and volume analysis, combined with fundamental metrics. Stocks are scored 0-100 with signals ranging from Accumulate to Strong Buy. Entry confidence is rated 50-100% based on 6 confirmation factors.
Disclaimer: This article is for informational purposes only and does not constitute financial advice. Past performance does not guarantee future results. Always conduct your own research and consult a qualified financial advisor before making investment decisions. Data as of June 26, 2026.
Related Articles
Disclaimer : The above information is for general informational purposes only. All information on the Site is provided in good faith, however we make no representation or warranty of any kind, express or implied, regarding the accuracy, adequacy, validity, reliability, availability or completeness of any information on the Site.