
10 Stocks with Strong Buy Signals and High Scores – July 2026
MarketsHost.com identifies 10 stocks, including Visa (V) with a 73 score and TriNet (TNET) with 46.84% 3-month returns, all showing Strong Buy signals for July 2026.
by Kowsalya
Published Jul 31, 2026 | Updated Jul 31, 2026 | 📖 11 min read
Article continues below advertisement
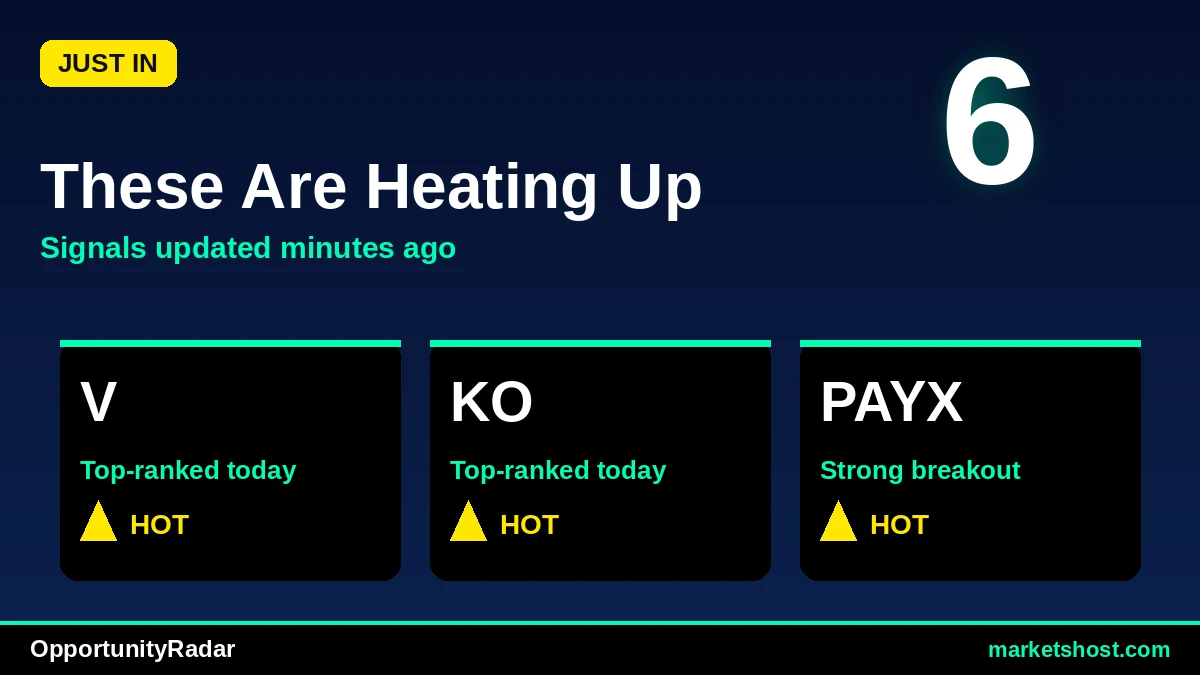
Top 10 Stocks with Strong Buy Signals Identified by OpportunityRadar for July 2026
As July 2026 draws to a close, MarketsHost.com's proprietary OpportunityRadar scanner has flagged a compelling list of stocks exhibiting robust technical strength and strong buy signals. Leading this selection is Visa Inc. (V), which stands out with an OpportunityRadar Score of 73 and a perfect 100% confidence rating for its 'BUY' signal. This top performer is joined by several other tickers, including TriNet Group, Inc. (TNET), which delivered an impressive 46.84% return over the past three months, underscoring significant upward momentum in various market segments.
The current scan reveals a widespread positive sentiment, with all the top 15 identified tickers generating a 'BUY' signal. A significant majority, 12 out of the 15, boast a 100% confidence rating for their 'STRONG ENTRY' recommendation. Furthermore, 14 of the 15 tickers show their MACD in 'BULL' territory, indicating favorable short-to-medium term price momentum. The average Relative Strength Index (RSI) across these 15 stocks hovers around 61.6, suggesting strong but not yet overbought conditions for most.
Top 10 Signals at a Glance
| # | Ticker | Company | Price | Score | Confidence | RSI | MACD | 1-Month Return |
|---|---|---|---|---|---|---|---|---|
| 1 | V | Visa Inc. | $364.95 | 73 | 100% | 61.9 | BULL | 0.78% |
| 2 | KO | Coca-Cola Company (The) | $87.61 | 67 | 100% | 62.5 | BULL | 4.12% |
| 3 | PAYX | Paychex, Inc. | $116.65 | 66 | 83% | 61.5 | BULL | 9.69% |
| 4 | TNET | TriNet Group, Inc. | $65.30 | 66 | 100% | 63.6 | BULL | 18.28% |
| 5 | MMM | 3M Company | $176.34 | 66 | 100% | 64.9 | BULL | 9.91% |
| 6 | ITW | Illinois Tool Works Inc. | $286.16 | 65 | 100% | 60.2 | BULL | 4.91% |
| 7 | XOM | ExxonMobil Holdings Corporatio | $153.70 | 65 | 83% | 59.2 | BULL | 12.12% |
| 8 | ALL | Allstate Corporation (The) | $266.69 | 64 | 100% | 64.6 | BULL | 6.54% |
| 9 | OII | Oceaneering International, Inc | $48.12 | 63 | 100% | 61.8 | BULL | 24.99% |
| 10 | WLY | John Wiley & Sons, Inc. | $51.48 | 63 | 100% | 54.8 | BULL | -2.43% |
#1: V — Visa Inc.
Visa Inc. (V) registers as the top-ranked stock in this scan, boasting an OpportunityRadar Score of 73. Its technical score is 71, complemented by a fundamental score of 75, suggesting a balanced strength. The 'BUY' signal carries a 100% confidence rating, indicating a 'STRONG ENTRY' opportunity. V's current price stands at $364.95. Technical indicators show an RSI of 61.9 and MACD in 'BULL' territory, reflecting positive momentum. Over the last three months, V has delivered an 11.26% return, though its one-month return is a more modest 0.78%.
While V's overall score and confidence are high, its Risk/Reward ratio is 0.4. This low ratio suggests that for every unit of potential profit, there is a comparatively larger unit of potential risk based on current stop and target levels. Investors should consider this numerical relationship when evaluating the 'STRONG ENTRY' signal, despite the strong technical and fundamental scores.
#2: KO — Coca-Cola Company (The)
The Coca-Cola Company (KO) appears on the radar with a solid OpportunityRadar Score of 67, composed of a technical score of 65 and a fundamental score of 70. The scanner indicates a 'BUY' signal with a 100% confidence level and a 'STRONG ENTRY' recommendation at its current price of $87.61. Technical metrics support this outlook, with an RSI of 62.5 and MACD firmly in 'BULL' territory. KO has demonstrated consistent performance, with a 4.12% return over the past month and an 11.49% gain over the last three months.
Similar to Visa, Coca-Cola's Risk/Reward ratio is 0.4. This numerical value implies that the potential reward is relatively small compared to the defined risk. While the stock shows strong technical signals and high confidence, the lower Risk/Reward ratio could be a point of consideration for risk-averse strategies looking for a more favorable risk-to-return profile.
#3: PAYX — Paychex, Inc.
Paychex, Inc. (PAYX) is highlighted with an OpportunityRadar Score of 66. Its technical score of 71 is notably higher than its fundamental score of 58. The 'BUY' signal for PAYX comes with an 83% confidence rating, indicating a 'STRONG ENTRY' at its current price of $116.65. Technical analysis shows an RSI of 61.5 and MACD in 'BULL' status. PAYX has exhibited strong price appreciation, with a 9.69% return in the last month and an impressive 25.4% gain over the past three months.
A point to note for PAYX is its 83% confidence rating, which, while strong, is not at the 100% level seen in some other top signals. This slightly lower confidence might suggest a minor divergence or less complete alignment across all confirmation factors compared to those with maximum confidence. Additionally, its Risk/Reward ratio is 0.7, which is somewhat improved but still indicates a relatively conservative risk profile.
#4: TNET — TriNet Group, Inc.
TriNet Group, Inc. (TNET) garners an OpportunityRadar Score of 66, driven by a robust technical score of 73 and a fundamental score of 56. The scanner issues a 'BUY' signal with a 100% confidence rating for a 'STRONG ENTRY' at its price of $65.30. TNET's technical picture is compelling, with an RSI of 63.6 and MACD in 'BULL' territory. The stock has shown exceptional performance, returning 18.28% in the last month and a remarkable 46.84% over the past three months, making it the highest 3-month gainer among the top 10.
Despite its strong recent performance and 100% confidence 'BUY' signal, TNET's fundamental score of 56 is the lowest among the top four tickers. While the technical strength is undeniable, the lower fundamental score, when compared to its technical counterpart, is a data point worth observing. However, its Risk/Reward ratio of 1.2 is more favorable than many others on this list, suggesting a better balance between potential gain and risk.
#5: MMM — 3M Company
3M Company (MMM) registers an OpportunityRadar Score of 66, with a technical score of 71 and a fundamental score of 58. The scanner has identified a 'BUY' signal with a full 100% confidence for a 'STRONG ENTRY' at its current price of $176.34. The technical indicators for MMM are positive, showing an RSI of 64.9 and MACD in 'BULL' status. The company has experienced significant upward movement, posting a 9.91% return over the last month and a 23.75% gain over the past three months.
The RSI for MMM, at 64.9, is among the higher values on this list, approaching the 70 threshold often associated with overbought conditions. While still within acceptable bullish ranges, sustained upward movement without consolidation could push it into overbought territory, which might precede a short-term pullback. Additionally, its Risk/Reward ratio of 0.5 suggests a limited potential upside relative to the downside risk.
#6: ITW — Illinois Tool Works Inc.
Illinois Tool Works Inc. (ITW) is featured with an OpportunityRadar Score of 65, comprising a technical score of 69 and a fundamental score of 58. The scanner recommends a 'BUY' signal with 100% confidence, indicating a 'STRONG ENTRY' at its price of $286.16. Technical analysis shows ITW's RSI at 60.2 and MACD in 'BULL' territory, supporting the positive signal. The stock has delivered consistent returns, with a 4.91% gain in the last month and a 12.01% increase over the past three months.
ITW's Risk/Reward ratio is 0.6. This specific numerical value, while not the lowest on the list, indicates that the potential reward for taking on this position is less than the potential risk, which is a factor for investors to consider. Despite the 100% confidence in the 'BUY' signal, the risk/reward profile suggests a more cautious approach to position sizing.
#7: XOM — ExxonMobil Holdings Corporatio
ExxonMobil Holdings Corporation (XOM) appears with an OpportunityRadar Score of 65, with a technical score of 69 and a fundamental score of 60. The scanner issues a 'BUY' signal with an 83% confidence rating, suggesting a 'STRONG ENTRY' at its current price of $153.70. Technical indicators include an RSI of 59.2 and MACD in 'BULL' status. XOM has seen a strong 12.12% return in the last month, though its three-month return is a more modest 0.62%.
A notable divergence for XOM is the stark difference between its one-month return of 12.12% and its three-month return of just 0.62%. This indicates that most of its recent gains have been concentrated in the very short term, which could signal increased volatility or a recent catalyst that has not been sustained over the broader quarter. Furthermore, its Risk/Reward ratio is 0.3, the lowest among the top 10, implying a significantly higher risk relative to potential reward.
#8: ALL — Allstate Corporation (The)
The Allstate Corporation (ALL) is highlighted with an OpportunityRadar Score of 64, with a technical score of 70 and a fundamental score of 55. A 'BUY' signal has been issued with a 100% confidence rating, indicating a 'STRONG ENTRY' at its price of $266.69. Technical analysis shows an RSI of 64.6 and MACD in 'BULL' territory. ALL has delivered robust performance, with a 6.54% return over the last month and a substantial 23.13% gain over the past three months.
Allstate's fundamental score of 55 is the lowest among the top 8 tickers, indicating that while its technical setup is strong, its underlying fundamental metrics, as assessed by the scanner, are less compelling compared to its technical strength. Additionally, its Risk/Reward ratio stands at 0.4, which suggests that the potential reward is less than the potential risk associated with the trade.
#9: OII — Oceaneering International, Inc
Oceaneering International, Inc (OII) registers an OpportunityRadar Score of 63, with a technical score of 67 and a fundamental score of 56. The scanner has issued a 'BUY' signal with a 100% confidence rating, recommending a 'STRONG ENTRY' at its current price of $48.12. Technical indicators show an RSI of 61.8 and MACD in 'BULL' status. OII has demonstrated particularly strong momentum, with an impressive 24.99% return in the last month and a 29.81% gain over the past three months, marking the highest one-month return among the top 10.
While OII's recent returns are exceptional, its fundamental score of 56 is on the lower end of the spectrum for the top signals, similar to TriNet and Allstate. This suggests that the primary driver for its 'BUY' signal and high confidence is its technical strength and momentum. Its Risk/Reward ratio of 1.2 is a positive factor, indicating a more balanced risk-to-reward profile than many other tickers on this list.
#10: WLY — John Wiley & Sons, Inc.
John Wiley & Sons, Inc. (WLY) rounds out the top 10 with an OpportunityRadar Score of 63, reflecting a technical score of 68 and a fundamental score of 56. The scanner has issued a 'BUY' signal with a 100% confidence rating, indicating a 'STRONG ENTRY' at its price of $51.48. Technical analysis shows an RSI of 54.8 and MACD in 'BULL' territory. Over the last three months, WLY has seen a strong 25.78% return, but its one-month return is negative at -2.43%.
The most significant risk factor for WLY is its negative one-month return of -2.43%, despite receiving a 100% confidence 'BUY' signal and a 'STRONG ENTRY' recommendation. This divergence suggests that while the longer-term trend (3-month return) is positive, the stock has experienced recent weakness, which could indicate a potential short-term reversal or increased volatility. However, its Risk/Reward ratio of 1.5 is the highest among the top 10, indicating a more favorable balance of potential upside to downside risk.
Key Observations Across the Scan
The July 31, 2026, OpportunityRadar scan highlights a broad positive outlook across the identified stocks. All 15 tickers on the exhaustive list received a 'BUY' signal, with 12 of them demonstrating a 100% confidence rating for a 'STRONG ENTRY'. A strong majority, 14 out of 15, show their MACD in 'BULL' territory, indicating prevailing upward momentum. The average RSI across all 15 tickers is approximately 61.6, suggesting healthy, non-overbought conditions for most. Oceaneering International, Inc. (OII) recorded the highest one-month return at 24.99%, while TriNet Group, Inc. (TNET) led with the highest three-month return at 46.84%. The Risk/Reward ratios varied significantly, with Sonic Automotive, Inc. (SAH) showing the highest at 2.0 and ExxonMobil Holdings Corporation (XOM) the lowest at 0.3.
Key Risk Factors
- Low Risk/Reward Ratios: Several tickers, including ExxonMobil Holdings Corporation (XOM) at 0.3, Visa Inc. (V) at 0.4, The Coca-Cola Company (KO) at 0.4, and Allstate Corporation (ALL) at 0.4, exhibit low Risk/Reward ratios. This indicates that the potential upside, based on the scanner's targets, is proportionally smaller than the potential downside risk, which investors should weigh carefully.
- Divergent MACD Signal: Sonic Automotive, Inc. (SAH) stands out as the only ticker on the entire list of 15 with a 'MACD BEAR' signal, despite receiving a 'BUY' signal with 83% confidence and a 'STRONG ENTRY'. This technical divergence warrants closer inspection as it suggests a potential weakening of short-term momentum contrary to the overall buy recommendation.
- Negative Short-Term Performance: John Wiley & Sons, Inc. (WLY) shows a negative one-month return of -2.43%. While its three-month return is strong at 25.78% and it holds a 100% confidence 'BUY' signal, this recent short-term decline could indicate a temporary pullback or a shift in immediate price action that may challenge the 'STRONG ENTRY' thesis.
About Our Methodology
OpportunityRadar scans 6,600+ US stocks daily using 15+ technical indicators including RSI, MACD, Bollinger Bands, ADX, Aroon, support/resistance levels, and volume analysis, combined with fundamental metrics. Stocks are scored 0-100 with signals ranging from Accumulate to Strong Buy. Entry confidence is rated 50-100% based on 6 confirmation factors.
Disclaimer: This article is for informational purposes only and does not constitute financial advice. Past performance does not guarantee future results. Always conduct your own research and consult a qualified financial advisor before making investment decisions. Data as of July 31, 2026.
Related Articles

Disclaimer : The above information is for general informational purposes only. All information on the Site is provided in good faith, however we make no representation or warranty of any kind, express or implied, regarding the accuracy, adequacy, validity, reliability, availability or completeness of any information on the Site.