
10 Stocks Flash 100% Confidence Buy Signals in July 2026 Scan
Our July 2026 scan highlights 10 stocks with 100% Confidence Buy signals, including SIRI with a 76 OpportunityRadar Score and DYN with a 15.49% 1-month return.
by Kowsalya
Published Jul 30, 2026 | Updated Jul 30, 2026 | 📖 10 min read
Article continues below advertisement
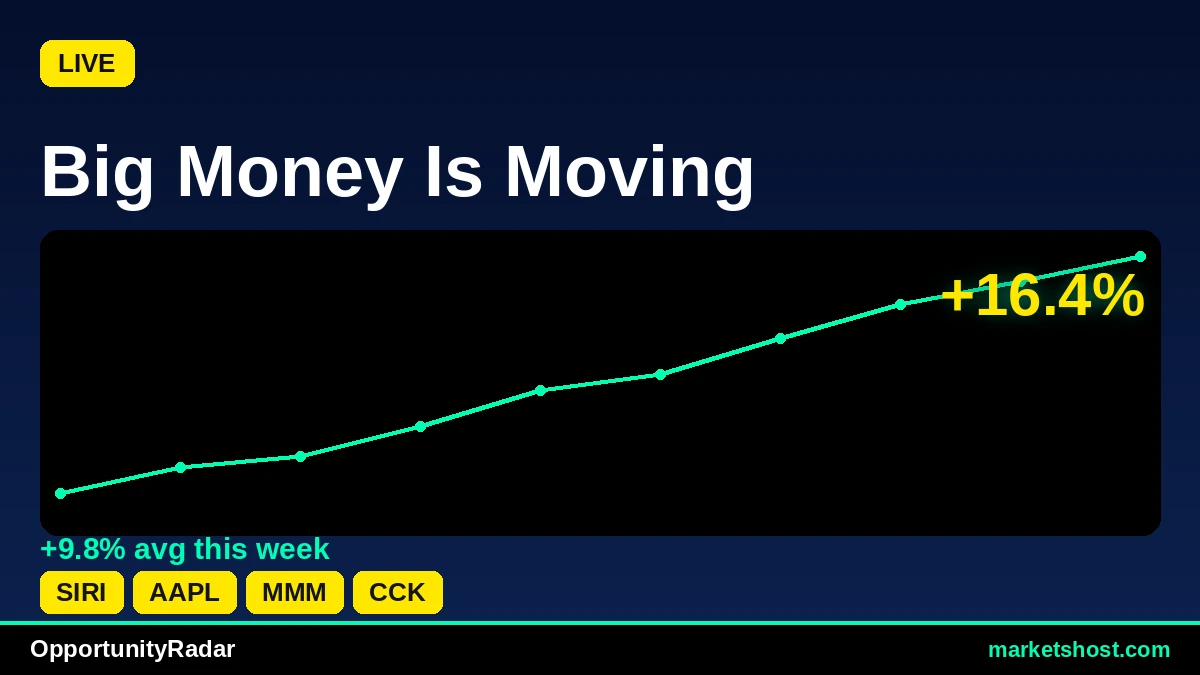
OpportunityRadar Identifies 10 Stocks with Unanimous Buy Confidence This July
The latest OpportunityRadar scan for July 30, 2026, reveals a compelling set of investment signals, with the top 10 tickers all registering a 'BUY' signal with 100% confidence and a 'STRONG ENTRY' recommendation. SiriusXM Holdings Inc. (SIRI) leads this group with the highest overall OpportunityRadar Score of 76, driven by a robust fundamental score of 95. Meanwhile, Dyne Therapeutics, Inc. (DYN) stands out for its impressive short-term performance, posting a 1-month return of 15.49% and a 3-month return of 43.39%.
Across the entire scanned universe, all 15 identified tickers exhibit a 100% confidence rating for their 'BUY' signals, indicating a broad alignment of positive technical and fundamental factors. Every single one of these 15 stocks also shows a MACD in BULL territory, further reinforcing the current positive momentum. The Relative Strength Index (RSI) readings for the top 10 tickers generally sit in a healthy range, mostly between 58 and 64, suggesting sustained buying interest without immediate signs of being overbought.
Top 10 Signals at a Glance
| # | Ticker | Company | Price | Score | Confidence | RSI | MACD | 1-Month Return |
|---|---|---|---|---|---|---|---|---|
| 1 | SIRI | SiriusXM Holdings Inc. | $31.41 | 76 | 100% | 59.7 | BULL | 4.87% |
| 2 | AAPL | Apple Inc. | $331.63 | 71 | 100% | 59.9 | BULL | 12.65% |
| 3 | MMM | 3M Company | $174.81 | 66 | 100% | 62.5 | BULL | 9.28% |
| 4 | CCK | Crown Holdings, Inc. | $118.14 | 65 | 100% | 61.1 | BULL | 6.08% |
| 5 | EXPE | Expedia Group, Inc. | $291.09 | 65 | 100% | 63.8 | BULL | 10.04% |
| 6 | SYY | Sysco Corporation | $84.32 | 65 | 100% | 59.2 | BULL | 0.95% |
| 7 | ARWR | Arrowhead Pharmaceuticals, Inc | $86.57 | 65 | 100% | 60.7 | BULL | 7.62% |
| 8 | DYN | Dyne Therapeutics, Inc. | $25.17 | 64 | 100% | 63.6 | BULL | 15.49% |
| 9 | TRV | The Travelers Companies, Inc. | $372.01 | 64 | 100% | 60.6 | BULL | 11.17% |
| 10 | WLY | John Wiley & Sons, Inc. | $52.52 | 64 | 100% | 58.3 | BULL | 2.96% |
#1: SIRI — SiriusXM Holdings Inc.
SiriusXM Holdings Inc. (SIRI) registers the highest OpportunityRadar Score among the top 10 at 76, reflecting a strong fundamental component score of 95, significantly outweighing its technical score of 64. The stock is currently priced at $31.41. It carries a 'BUY' signal with 100% confidence and a 'STRONG ENTRY' recommendation. Technical indicators show an RSI of 59.7, positioned in neutral territory, and a MACD in BULL status, indicating positive momentum. Over the past month, SIRI has delivered a return of 4.87%, extending to a 3-month return of 16.59%.
While SIRI's high fundamental score is notable, its Risk/Reward ratio of 0.5 suggests that for every unit of potential reward, there is half a unit of potential risk based on the scanner's calculations. Investors typically seek higher ratios, and this moderate figure warrants consideration despite the strong overall signal and confidence.
#2: AAPL — Apple Inc.
Apple Inc. (AAPL) shows an OpportunityRadar Score of 71, with its technical score at 65 and fundamental score at 80. The stock is priced at $331.63 and has received a 'BUY' signal with 100% confidence and a 'STRONG ENTRY' recommendation. Technical analysis indicates an RSI of 59.9, suggesting balanced buying and selling pressure. The MACD is in BULL territory, confirming positive momentum. AAPL has demonstrated strong recent performance, with a 1-month return of 12.65% and a 3-month return of 22.21%.
Despite the strong returns and high confidence, AAPL's Risk/Reward ratio is 0.4. This relatively low ratio implies that the potential reward may be limited compared to the potential risk, according to the scanner's metrics. This is a factor to weigh against the strong technical and fundamental scores and the 100% confidence rating.
#3: MMM — 3M Company
3M Company (MMM) is currently priced at $174.81 and holds an OpportunityRadar Score of 66. Its technical score is 71, while its fundamental score stands at 58. The stock has been flagged with a 'BUY' signal and a 100% confidence rating, along with a 'STRONG ENTRY' recommendation. Technical indicators for MMM include an RSI of 62.5, which is nearing the upper end of the neutral range, and a MACD in BULL status, signaling continued upward price action. Recent performance shows a 1-month return of 9.28% and a 3-month return of 19.31%.
The RSI of 62.5, while not overbought, positions MMM closer to higher levels compared to some other stocks on the list. This could indicate a need for monitoring for potential short-term pullbacks, especially when considering its fundamental score of 58, which is lower than its technical score.
#4: CCK — Crown Holdings, Inc.
Crown Holdings, Inc. (CCK) is trading at $118.14 and has an OpportunityRadar Score of 65. Its technical score is 69, with a fundamental score of 58. The scanner has issued a 'BUY' signal for CCK, backed by 100% confidence and a 'STRONG ENTRY' recommendation. The technical picture includes an RSI of 61.1, indicating healthy buying interest, and a MACD in BULL territory, affirming a positive trend. CCK has posted a 1-month return of 6.08% and a solid 3-month return of 20.18%.
A notable aspect of CCK's data is its Risk/Reward ratio of 0.3, which is among the lowest observed in this scan. This low ratio suggests a comparatively higher risk for each unit of potential reward, based on the scanner's assessment. This quantitative measure should be considered alongside the strong technical indicators and high confidence signal.
#5: EXPE — Expedia Group, Inc.
Expedia Group, Inc. (EXPE) is priced at $291.09 and has an OpportunityRadar Score of 65, with a technical score of 69 and a fundamental score of 58. The stock has received a 'BUY' signal with 100% confidence and a 'STRONG ENTRY' recommendation. Technical analysis reveals an RSI of 63.8, indicating strong positive momentum, and a MACD in BULL status. EXPE has shown robust performance, delivering a 1-month return of 10.04% and a 3-month return of 17.2%.
EXPE's RSI of 63.8 is on the higher side within the neutral range, approaching levels that warrant attention. While still below the commonly accepted overbought threshold of 70, a sustained increase could lead to a more cautious outlook on its short-term price action, especially in conjunction with its fundamental score of 58.
#6: SYY — Sysco Corporation
Sysco Corporation (SYY) is currently trading at $84.32, with an OpportunityRadar Score of 65. Its technical score is 69, and its fundamental score is 58. The stock has a 'BUY' signal, 100% confidence, and a 'STRONG ENTRY' recommendation. Technical indicators show an RSI of 59.2, suggesting a balanced market, and a MACD in BULL territory, indicating positive price action. SYY's 1-month return is 0.95%, while its 3-month return stands at 12.87%.
Despite the strong 'BUY' signal and 100% confidence, SYY's 1-month return of 0.95% is the lowest among the top 10 tickers. This relatively subdued short-term performance, especially when compared to its solid 3-month return, might suggest a recent deceleration in its upward momentum, which could be a point of observation.
#7: ARWR — Arrowhead Pharmaceuticals, Inc
Arrowhead Pharmaceuticals, Inc (ARWR) is priced at $86.57, with an OpportunityRadar Score of 65. Its technical score is 69, and its fundamental score is 58. The scanner has generated a 'BUY' signal for ARWR, accompanied by 100% confidence and a 'STRONG ENTRY' recommendation. Technical analysis shows an RSI of 60.7, indicating a healthy upward trend, and a MACD in BULL status, confirming positive momentum. ARWR has delivered a 1-month return of 7.62% and a 3-month return of 17.81%.
ARWR stands out with a Risk/Reward ratio of 1.0, which is tied for the highest among the top 10. While this indicates a balanced risk-reward profile, the fundamental score of 58 is relatively lower than its technical score, suggesting that the current positive signal is predominantly driven by technical factors.
#8: DYN — Dyne Therapeutics, Inc.
Dyne Therapeutics, Inc. (DYN) is trading at $25.17 and holds an OpportunityRadar Score of 64. Its technical score is 69, and its fundamental score is 56. The stock has a 'BUY' signal with 100% confidence and a 'STRONG ENTRY' recommendation. Technical indicators include an RSI of 63.6, nearing the upper end of the neutral range, and a MACD in BULL territory. DYN has shown exceptional recent performance, with a 1-month return of 15.49% and an impressive 3-month return of 43.39%.
DYN's strong recent returns are a highlight, but its Risk/Reward ratio of 0.4 is on the lower side, similar to several other tickers on this list. This suggests that while recent momentum is strong, the calculated potential reward relative to potential risk is moderate, warranting careful consideration despite the compelling performance figures.
#9: TRV — The Travelers Companies, Inc.
The Travelers Companies, Inc. (TRV) is priced at $372.01, with an OpportunityRadar Score of 64. Its technical score is 70, and its fundamental score is 55. The scanner has issued a 'BUY' signal for TRV, supported by 100% confidence and a 'STRONG ENTRY' recommendation. Technical analysis shows an RSI of 60.6, indicating a balanced upward trend, and a MACD in BULL status. TRV has posted a 1-month return of 11.17% and a 3-month return of 21.91%.
TRV's fundamental score of 55 is the lowest among the top 10 profiled tickers, indicating that its current 'BUY' signal is primarily supported by its technical strength (score of 70) and positive momentum rather than fundamental underpinning. This imbalance between technical and fundamental scores could be a point of focus for investors.
#10: WLY — John Wiley & Sons, Inc.
John Wiley & Sons, Inc. (WLY) is trading at $52.52 and has an OpportunityRadar Score of 64. Its technical score is 69, and its fundamental score is 56. The stock has received a 'BUY' signal with 100% confidence and a 'STRONG ENTRY' recommendation. Technical indicators show an RSI of 58.3, suggesting a healthy, non-overbought condition, and a MACD in BULL territory. WLY has a 1-month return of 2.96% and a robust 3-month return of 28.32%.
Despite its high Risk/Reward ratio of 1.0, WLY's 1-month return of 2.96% is relatively modest compared to its strong 3-month performance of 28.32%. This divergence suggests that while the longer-term trend has been strong, the most immediate momentum has slowed, which could be a factor to consider for short-term entry.
Key Observations Across the Scan
- Universal Confidence: All 10 profiled tickers, and indeed all 15 tickers identified in the broader scan, registered a 'BUY' signal with 100% confidence and a 'STRONG ENTRY' recommendation. This indicates a rare and strong alignment of positive factors across the board.
- Consistent Momentum: Every single one of the 10 profiled tickers displayed a MACD in BULL territory, signaling consistent positive price momentum.
- Healthy RSI Levels: The RSI for these 10 tickers ranged from 58.3 (WLY) to 63.8 (EXPE), with an average RSI of approximately 60.9. These values suggest sustained buying interest without reaching typical overbought conditions (usually above 70).
- Strong 3-Month Returns: All 10 tickers showed positive 3-month returns, with Dyne Therapeutics, Inc. (DYN) leading significantly at 43.39%, followed by Neurocrine Biosciences, Inc. (NBIX) at 36.28% (from the broader scan) and John Wiley & Sons, Inc. (WLY) at 28.32%.
- Varying Risk/Reward Profiles: Risk/Reward ratios among the top 10 ranged from 0.3 (CCK) to 1.0 (ARWR, WLY), indicating diverse risk-adjusted potential despite uniform 'STRONG ENTRY' signals.
Key Risk Factors
- Lower Risk/Reward Ratios: Several tickers, including Crown Holdings, Inc. (CCK) at 0.3, Apple Inc. (AAPL) at 0.4, Dyne Therapeutics, Inc. (DYN) at 0.4, and Sysco Corporation (SYY) at 0.4, show relatively low Risk/Reward ratios. This indicates that the calculated potential reward for these stocks, relative to the potential risk, is not as favorable as others, despite the strong buy signals.
- Subdued 1-Month Performance: Sysco Corporation (SYY) with a 1-month return of 0.95% and John Wiley & Sons, Inc. (WLY) at 2.96% show considerably lower short-term gains compared to their 3-month performance and other high-confidence signals. This could suggest a recent slowdown in momentum that warrants close observation.
- Fundamental Score Disparity: For tickers like The Travelers Companies, Inc. (TRV), with a fundamental score of 55 versus a technical score of 70, and 3M Company (MMM) with a fundamental score of 58 versus a technical score of 71, the 'BUY' signal appears to be more heavily weighted by technical strength. Investors may wish to consider this imbalance, as strong technicals without robust fundamental backing can sometimes indicate shorter-term opportunities.
About Our Methodology
OpportunityRadar scans 6,600+ US stocks daily using 15+ technical indicators including RSI, MACD, Bollinger Bands, ADX, Aroon, support/resistance levels, and volume analysis, combined with fundamental metrics. Stocks are scored 0-100 with signals ranging from Accumulate to Strong Buy. Entry confidence is rated 50-100% based on 6 confirmation factors.
Disclaimer: This article is for informational purposes only and does not constitute financial advice. Past performance does not guarantee future results. Always conduct your own research and consult a qualified financial advisor before making investment decisions. Data as of July 30, 2026.
Related Articles


Disclaimer : The above information is for general informational purposes only. All information on the Site is provided in good faith, however we make no representation or warranty of any kind, express or implied, regarding the accuracy, adequacy, validity, reliability, availability or completeness of any information on the Site.