
10 Stocks Triggering Strong Entry Signals — July 2026
Our July 17, 2026 scanner data reveals 10 stocks with high OpportunityRadar Scores and strong entry signals, including Visa (V) at 70 and WD-40 (WDFC) with a 2.0 Risk/Reward.
by Kowsalya
Published Jul 17, 2026 | Updated Jul 17, 2026 | 📖 10 min read
Article continues below advertisement
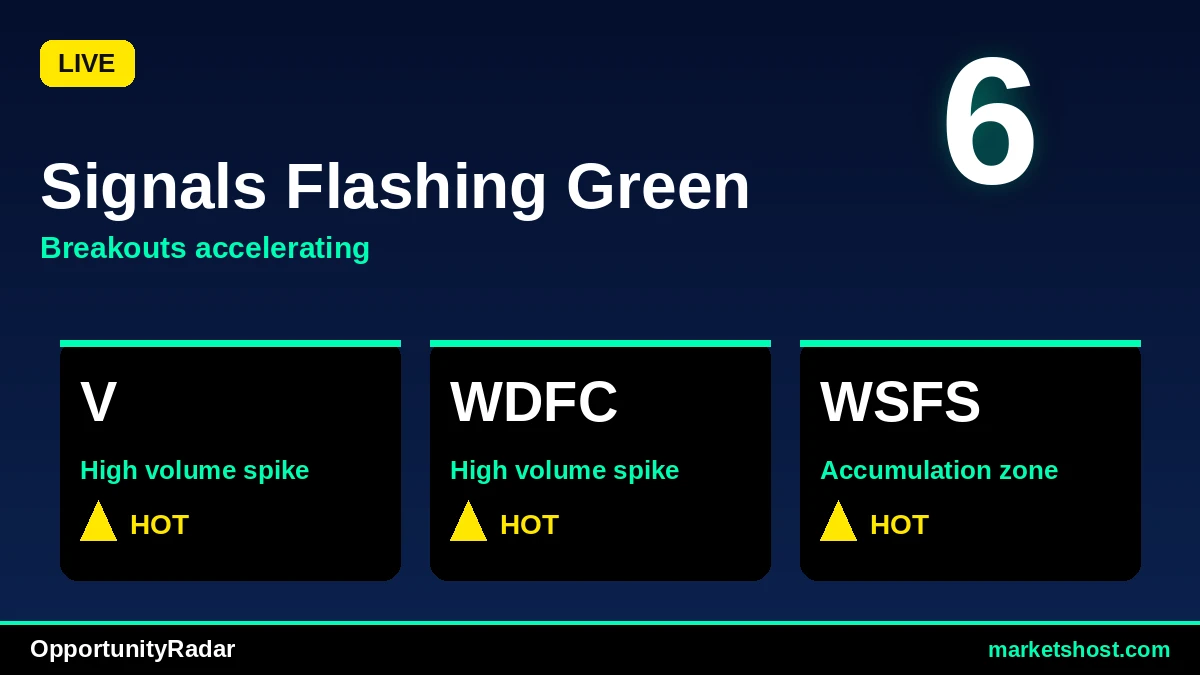
Wall Street Scanner Flags 10 Stocks with Strong Entry Signals This July
Our latest MarketsHost.com scanner data for July 17, 2026, highlights a compelling array of opportunities, with Visa Inc. (V) leading the pack with an impressive OpportunityRadar Score of 70. This top-tier signal is reinforced by a 100% confidence rating and a STRONG ENTRY recommendation, driven by a robust fundamental score of 75. Meanwhile, Integra LifeSciences Holdings (IART) and Fortinet, Inc. (FTNT) catch the eye with exceptional 3-month returns of 73.34% and 97.17% respectively, demonstrating significant price appreciation.
Across the initial 10 tickers identified, a significant trend emerges: seven of these opportunities, including Visa (V), WSFS Financial (WSFS), Match Group (MTCH), Integra LifeSciences (IART), American Homes 4 Rent (AMH), Pearson (PSO), and Enterprise Financial Services (EFSC), register a perfect 100% confidence rating for their respective BUY or STRONG BUY signals. The average Relative Strength Index (RSI) for these top 10 selections stands at approximately 60.66, generally indicating healthy momentum without being overtly overbought. Furthermore, eight of these top signals show a MACD in BULL territory, suggesting positive momentum trends.
Top 10 Signals at a Glance
| # | Ticker | Company | Price | Score | Confidence | RSI | MACD | 1-Month Return |
|---|---|---|---|---|---|---|---|---|
| 1 | V | Visa Inc. | $357.73 | 70 | 100% | 61.5 | BULL | 8.28% |
| 2 | WDFC | WD-40 Company | $249.93 | 68 | 83% | 57.5 | BEAR | 10.71% |
| 3 | WSFS | WSFS Financial Corporation | $79.19 | 65 | 100% | 62.2 | BULL | 7.66% |
| 4 | MTCH | Match Group, Inc. | $38.86 | 64 | 100% | 56.5 | BULL | 10.05% |
| 5 | IART | Integra LifeSciences Holdings | $19.31 | 64 | 100% | 62.9 | BULL | 12.27% |
| 6 | AMH | American Homes 4 Rent | $34.29 | 64 | 100% | 60.4 | BULL | 7.74% |
| 7 | FTNT | Fortinet, Inc. | $161.36 | 63 | 67% | 59.6 | BEAR | 11.95% |
| 8 | OPLN | OPENLANE, Inc. | $39.70 | 63 | 67% | 51.2 | BEAR | 6.66% |
| 9 | PSO | Pearson, Plc | $16.84 | 63 | 100% | 61.2 | BULL | 10.94% |
| 10 | EFSC | Enterprise Financial Services | $67.68 | 63 | 100% | 63.6 | BULL | 9.21% |
#1: V — Visa Inc.
Visa Inc. (V) registers the highest OpportunityRadar Score on our list at 70, reflecting a strong overall assessment with a technical score of 67 and an impressive fundamental score of 75. The scanner issues a clear BUY signal with 100% confidence and a STRONG ENTRY recommendation. Technical indicators support this positive outlook, with the Relative Strength Index (RSI) at 61.5 and the MACD in BULL territory, suggesting a healthy upward momentum. Over the past month, V has delivered an 8.28% return, extending to a 12.84% return over three months.
Despite the robust scores and strong technical alignment, the Risk/Reward ratio for Visa stands at 0.2. This low ratio indicates that the potential reward, as measured by the scanner, is significantly smaller relative to the defined risk, which may suggest a tighter risk management approach is warranted or that the stock is trading close to a potential stop level.
#2: WDFC — WD-40 Company
WD-40 Company (WDFC) receives a STRONG BUY signal, the most emphatic recommendation on our current scan, backed by an OpportunityRadar Score of 68. Its technical score is notably high at 78, contributing significantly to the STRONG ENTRY signal, even with a fundamental score of 53. The stock has demonstrated strong recent performance, with a 1-month return of 10.71% and a 3-month return of 17.13%. The RSI is at 57.5, indicating a balanced momentum.
A point of divergence for WDFC is its MACD, which is currently in BEAR territory despite the STRONG BUY signal and strong technical score. This could suggest a recent shift in short-term momentum that warrants close monitoring. Additionally, while the confidence rating is 83%, it is not at the 100% level seen in several other top signals. However, the Risk/Reward ratio of 2.0 is the highest among the top 10, indicating a favorable potential reward relative to risk.
#3: WSFS — WSFS Financial Corporation
WSFS Financial Corporation (WSFS) presents a compelling BUY signal with a perfect 100% confidence rating and a STRONG ENTRY recommendation, reflected in its OpportunityRadar Score of 65. The technical score for WSFS is 71, supported by a MACD in BULL territory and an RSI of 62.2, which points to sustained positive price action. The stock has posted a 7.66% return over the last month and a 12.48% return over the last three months.
While the overall signal is strong, the Risk/Reward ratio for WSFS is 0.8. This ratio, being below 1.0, suggests that the potential reward from the current entry point may be slightly less than the potential risk, based on the scanner's calculations. Investors typically prefer a ratio above 1.0, indicating that this aspect requires careful consideration despite the high confidence in the BUY signal.
#4: MTCH — Match Group, Inc.
Match Group, Inc. (MTCH) enters our top 10 with an OpportunityRadar Score of 64, driven by a BUY signal with 100% confidence and a STRONG ENTRY. The technical score stands at 69, with the MACD in BULL territory and a healthy RSI of 56.5. This combination of indicators suggests a positive price trend with room for continued upward movement. The stock has shown strong recent performance, gaining 10.05% in the last month.
However, the 3-month return for MTCH is 9.43%, which is slightly lower than its 1-month return, indicating that recent momentum has accelerated compared to the broader quarter. The Risk/Reward ratio is 0.6, which, similar to several other tickers on this list, points to a lower potential reward relative to the identified risk. This factor could influence position sizing or risk management strategies.
#5: IART — Integra LifeSciences Holdings
Integra LifeSciences Holdings (IART) is highlighted with an OpportunityRadar Score of 64, featuring a BUY signal, 100% confidence, and a STRONG ENTRY. The stock's technical score is 71, supported by a MACD in BULL territory and an RSI of 62.9. What truly stands out for IART are its exceptional returns: a 1-month gain of 12.27% and a remarkable 3-month return of 73.34%, indicating significant upward price movement over the past quarter.
Despite these impressive returns and high confidence, the Risk/Reward ratio for IART is 0.5, suggesting that the potential for further reward, according to the scanner's metrics, is half the potential risk. The strong recent appreciation, as evidenced by the 3-month return, also places the RSI at 62.9, which, while not overbought, is on the higher side of the spectrum, indicating substantial buying pressure.
#6: AMH — American Homes 4 Rent
American Homes 4 Rent (AMH) secures a spot with an OpportunityRadar Score of 64, signaling a BUY with 100% confidence and a STRONG ENTRY. The technical score is 68, complementing a fundamental score of 58. The stock's technical posture is positive, with its MACD in BULL territory and an RSI of 60.4, indicating a steady upward trend. AMH has delivered consistent returns, with a 7.74% gain over the past month and an 11.75% gain over the last three months.
A key consideration for AMH is its Risk/Reward ratio of 0.5. This low ratio suggests that the potential reward from the current price point is limited relative to the identified risk. While the overall signal confidence is high, this specific metric points to a need for careful risk assessment, especially for investors prioritizing a higher reward-to-risk profile.
#7: FTNT — Fortinet, Inc.
Fortinet, Inc. (FTNT) is identified with an OpportunityRadar Score of 63 and a BUY signal. This stock is notable for its extraordinary 3-month return of 97.17%, nearly doubling its value, alongside a strong 1-month return of 11.95%. The RSI is at a healthy 59.6. Its technical score is 66, and its fundamental score is 58.
However, the confidence rating for FTNT's signal is 67%, lower than the 100% seen in many other top signals, and the entry is simply "ENTRY" rather than "STRONG ENTRY." A more significant point of caution is that the MACD is in BEAR territory, which contrasts with the BUY signal and the stock's recent robust price performance. This divergence between price action and momentum indicators suggests underlying cross-currents that may warrant additional scrutiny. The Risk/Reward ratio is also relatively low at 0.6.
#8: OPLN — OPENLANE, Inc.
OPENLANE, Inc. (OPLN) shows an OpportunityRadar Score of 63, issuing a BUY signal with an ENTRY recommendation. The stock has experienced a solid 3-month return of 25.51% and a 1-month return of 6.66%. Its technical score is 68, and the RSI is at a neutral 51.2, indicating no immediate overbought or oversold conditions. The Risk/Reward ratio for OPLN stands at 1.0, suggesting a balanced potential for reward relative to risk.
Despite the balanced Risk/Reward and positive 3-month performance, the confidence rating for OPLN's signal is 67%, which is on the lower side compared to the majority of high-conviction signals on this list. Furthermore, the MACD is in BEAR territory, which contradicts the BUY signal and could indicate a weakening of upward momentum or a potential short-term reversal that investors should monitor closely.
#9: PSO — Pearson, Plc
Pearson, Plc (PSO) registers an OpportunityRadar Score of 63, backed by a BUY signal with 100% confidence and a STRONG ENTRY. The technical score is 69, with the MACD in BULL territory and an RSI of 61.2, indicating a positive trend with healthy momentum. Pearson has delivered a 1-month return of 10.94% and a 3-month return of 14.87%, demonstrating consistent upward movement.
The Risk/Reward ratio for Pearson is 0.5, which is among the lower values on this list. This suggests that the potential upside, as determined by the scanner's risk parameters, is half the potential downside. While the high confidence in the BUY signal is encouraging, the low Risk/Reward ratio is a factor that investors may wish to weigh carefully in their decision-making process.
#10: EFSC — Enterprise Financial Services
Enterprise Financial Services (EFSC) completes our top 10 list with an OpportunityRadar Score of 63, a BUY signal, 100% confidence, and a STRONG ENTRY. Its technical score is 68, supported by a MACD in BULL territory and an RSI of 63.6, pointing to strong positive momentum. The stock has shown consistent gains, with a 9.21% return over the last month and a 15.35% return over the last three months.
While EFSC exhibits strong confidence and positive technicals, its Risk/Reward ratio is 0.7. This ratio, being below 1.0, indicates that the calculated potential reward is somewhat less than the potential risk. Additionally, the RSI of 63.6 is one of the higher readings on this list, suggesting that the stock has experienced significant buying activity and is approaching the upper end of typical healthy momentum ranges.
Key Observations Across the Scan
- High Confidence Dominance: A significant majority, seven out of the ten profiled tickers (V, WSFS, MTCH, IART, AMH, PSO, EFSC), received a 100% confidence rating for their signals, indicating strong alignment across the scanner's confirmation factors.
- Positive Momentum: Eight of the ten tickers (V, WSFS, MTCH, IART, AMH, PSO, EFSC, UBSI, AMG, ES) show their MACD in BULL territory, suggesting a prevailing upward momentum trend among these selections.
- Strong Short-Term Performance: Five tickers (WDFC, MTCH, IART, FTNT, PSO) recorded 1-month returns exceeding 10%, with Integra LifeSciences Holdings (IART) leading at 12.27%.
- Exceptional Quarterly Gains: Three tickers (IART, FTNT, OPLN) demonstrated substantial 3-month returns exceeding 25%, with Fortinet, Inc. (FTNT) showing an impressive 97.17% gain and Integra LifeSciences Holdings (IART) at 73.34%.
- Varied Risk/Reward Profiles: The Risk/Reward ratios varied significantly, from a low of 0.2 for Visa (V) to a high of 2.0 for WD-40 Company (WDFC), highlighting diverse risk-return characteristics within the strong signals.
Key Risk Factors
- Low Risk/Reward Ratios: A notable number of the top 10 tickers exhibit Risk/Reward ratios below 1.0. Visa (V) has a ratio of 0.2, Integra LifeSciences (IART) and American Homes 4 Rent (AMH) are at 0.5, Pearson (PSO) is at 0.5, Match Group (MTCH) and Fortinet (FTNT) are at 0.6, WSFS Financial (WSFS) is at 0.8, and Enterprise Financial Services (EFSC) is at 0.7. These lower ratios suggest that the potential upside, as defined by the scanner, is less than the potential downside from the current entry.
- MACD Divergence: Three tickers, WD-40 Company (WDFC), Fortinet (FTNT), and OPENLANE (OPLN), show a MACD in BEAR territory despite receiving BUY or STRONG BUY signals. This divergence between the signal and the MACD indicator suggests that underlying bearish momentum might be present, which could conflict with the overall positive signal.
- Lower Confidence Signals: Fortinet (FTNT) and OPENLANE (OPLN) both carry a confidence rating of 67%, which is lower than the 100% confidence observed in many other strong entry signals on this list. This indicates fewer confirming factors aligning for these specific opportunities compared to their higher-confidence counterparts.
About Our Methodology
OpportunityRadar scans 6,600+ US stocks daily using 15+ technical indicators including RSI, MACD, Bollinger Bands, ADX, Aroon, support/resistance levels, and volume analysis, combined with fundamental metrics. Stocks are scored 0-100 with signals ranging from Accumulate to Strong Buy. Entry confidence is rated 50-100% based on 6 confirmation factors.
Disclaimer: This article is for informational purposes only and does not constitute financial advice. Past performance does not guarantee future results. Always conduct your own research and consult a qualified financial advisor before making investment decisions. Data as of July 17, 2026.
Related Articles




Disclaimer : The above information is for general informational purposes only. All information on the Site is provided in good faith, however we make no representation or warranty of any kind, express or implied, regarding the accuracy, adequacy, validity, reliability, availability or completeness of any information on the Site.