10 Stocks Hit Strong Buy Signals in September 2026 Scan
OpportunityRadar's September 2026 scan reveals 10 stocks with BUY signals, including 6 at 100% confidence and high technical scores. Explore key metrics.
by Kowsalya
Published Sep 22, 2026 | Updated Sep 22, 2026 | 📖 10 min read
Article continues below advertisement
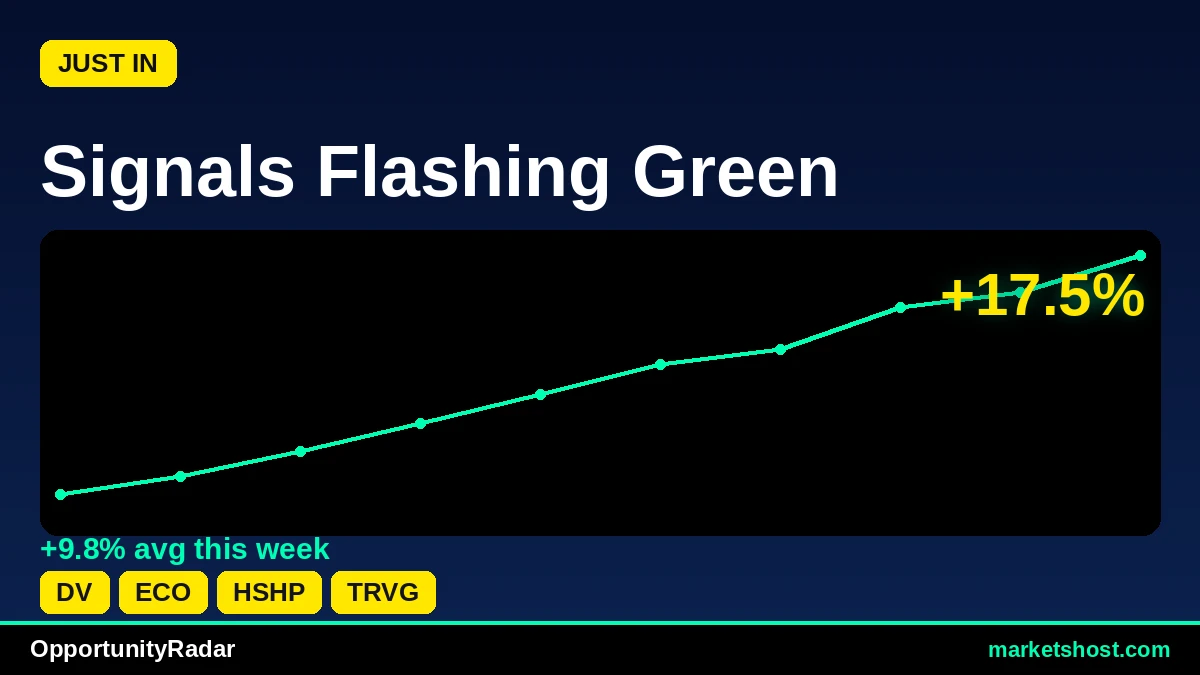
OpportunityRadar Spotlights 10 Strong Buy Signals for September 2026
The latest OpportunityRadar scan for September 22, 2026, highlights a compelling set of 10 stocks, all registering BUY signals. Among these, Okeanis Eco Tankers Corp. (ECO) stands out with a top OpportunityRadar Score of 64, driven by a strong technical score of 72, alongside a 100% confidence rating and a 'STRONG ENTRY' signal. DoubleVerify Holdings, Inc. (DV) also shares the highest overall score of 64, with a technical score of 69, though its confidence sits at 67%.
This current scan reveals a significant number of high-conviction opportunities, with 6 of the top 10 tickers receiving a 100% confidence rating for their BUY signals, indicating robust alignment across underlying factors. The average Relative Strength Index (RSI) across these 10 highlighted stocks sits at approximately 59.07, suggesting generally healthy price momentum without being in overtly overbought territory. All 10 tickers presented in this analysis are flagged with a 'BUY' signal, with the majority also receiving a 'STRONG ENTRY' recommendation, reflecting a broad positive sentiment from the OpportunityRadar system.
Top 10 Signals at a Glance
| # | Ticker | Company | Price | Score | Confidence | RSI | MACD | 1-Month Return |
|---|---|---|---|---|---|---|---|---|
| 1 | DV | DoubleVerify Holdings, Inc. | $13.4 | 64 | 67% | 62.7 | BEAR | 0.71% |
| 2 | ECO | Okeanis Eco Tankers Corp. | $78.69 | 64 | 100% | 61.5 | BULL | 20.8% |
| 3 | HSHP | Himalaya Shipping Ltd. | $18.3 | 63 | 100% | 58.7 | BULL | 10.64% |
| 4 | TRVG | trivago N.V. | $6.2 | 62 | 100% | 56.8 | BULL | 11.11% |
| 5 | TEVA | Teva Pharmaceutical Industries | $39.36 | 62 | 100% | 61.6 | BULL | 6.58% |
| 6 | TVA | Texas Ventures Acquisition III | $10.56 | 61 | 83% | 60.0 | BULL | 0.32% |
| 7 | NEO | NeoGenomics, Inc. | $19.16 | 61 | 100% | 63.8 | BULL | 16.73% |
| 8 | ARE | Alexandria Real Estate Equitie | $54.26 | 61 | 83% | 57.5 | BULL | 0.41% |
| 9 | MGNI | Magnite, Inc. | $24.53 | 61 | 100% | 56.2 | BULL | 4.12% |
| 10 | HNST | The Honest Company, Inc. | $5.33 | 61 | 67% | 51.9 | BEAR | 2.6% |
#1: DV — DoubleVerify Holdings, Inc.
DoubleVerify Holdings, Inc. (DV) registers an OpportunityRadar Score of 64, with a technical score of 69 indicating notable strength in its price action. The system issues a 'BUY' signal, accompanied by a 67% confidence rating and an 'ENTRY' recommendation. Its Relative Strength Index (RSI) stands at 62.7, suggesting positive momentum, although the MACD is currently in 'BEAR' territory. Over the past month, DV has seen a modest return of 0.71%, while its three-month return is a more substantial 29.42%. The Risk/Reward ratio for DV is calculated at 1.7.
A key aspect to monitor for DV is the MACD, which is in a 'BEAR' state despite the overall 'BUY' signal and positive RSI of 62.7. This divergence between momentum indicators could warrant closer observation. Additionally, while the 3-month return is strong, the 1-month return of 0.71% is relatively subdued compared to its high OpportunityRadar Score and technical strength.
#2: ECO — Okeanis Eco Tankers Corp.
Okeanis Eco Tankers Corp. (ECO) achieves the highest OpportunityRadar Score in this scan at 64, supported by an impressive technical score of 72. The system flags ECO with a 'BUY' signal and a robust 100% confidence rating, designating it as a 'STRONG ENTRY'. Technical indicators show an RSI of 61.5 and a 'MACD BULL' signal, pointing to sustained upward momentum. ECO has demonstrated significant performance, with a 20.8% return over the last month and a 44.54% gain over three months. The Risk/Reward ratio for ECO is 1.1.
While ECO exhibits strong technicals and high confidence, its Risk/Reward ratio of 1.1 suggests a relatively balanced risk profile for the potential reward. Investors should note this ratio in context of its substantial 1-month return of 20.8% and 3-month return of 44.54%, which indicate a stock that has already seen considerable appreciation.
#3: HSHP — Himalaya Shipping Ltd.
Himalaya Shipping Ltd. (HSHP) shows an OpportunityRadar Score of 63, with its technical score at 69. The stock receives a 'BUY' signal with a 100% confidence rating and a 'STRONG ENTRY' recommendation. Its RSI is 58.7, and the MACD is firmly in 'BULL' territory, indicating positive price action. HSHP has delivered strong returns, with a 10.64% gain in the last month and a 30.25% increase over the past three months. The Risk/Reward ratio for HSHP is 0.7.
The Risk/Reward ratio of 0.7 for HSHP is among the lower figures in this scan, implying that the potential reward may be less significant relative to the inherent risk. Despite the 100% confidence and 'STRONG ENTRY' signal, this lower ratio, coupled with a 1-month return of 10.64% following a 3-month gain of 30.25%, suggests a need for careful consideration of entry points given recent appreciation.
#4: TRVG — trivago N.V.
trivago N.V. (TRVG) is featured with an OpportunityRadar Score of 62, backed by a technical score of 68. The system assigns a 'BUY' signal with 100% confidence and a 'STRONG ENTRY' designation. Its technical profile includes an RSI of 56.8 and a 'MACD BULL' signal, suggesting favorable momentum. TRVG has shown solid performance, with an 11.11% return over the last month and a 20.62% gain over three months. The Risk/Reward ratio for TRVG is 1.0.
TRVG's Risk/Reward ratio of 1.0 indicates an even balance between potential risk and reward. While the 100% confidence and 'STRONG ENTRY' are compelling, this ratio, alongside a 1-month return of 11.11%, suggests that the stock's recent upward movement might be priced in, requiring investors to assess the sustainability of this momentum.
#5: TEVA — Teva Pharmaceutical Industries
Teva Pharmaceutical Industries (TEVA) garners an OpportunityRadar Score of 62, with a technical score of 64 and a fundamental score of 58. It receives a 'BUY' signal with 100% confidence and a 'STRONG ENTRY' recommendation. Technical indicators include an RSI of 61.6 and a 'MACD BULL' signal, reflecting positive price momentum. TEVA has delivered a 6.58% return over the last month and a 15.02% gain over the past three months. The Risk/Reward ratio for TEVA is 0.4.
TEVA's Risk/Reward ratio of 0.4 is notably low, suggesting that the potential reward is significantly smaller than the inherent risk according to the OpportunityRadar model. Despite the 100% confidence and 'STRONG ENTRY' signal, this particular metric, combined with a 1-month return of 6.58%, points to a need for caution regarding the risk-adjusted upside potential.
#6: TVA — Texas Ventures Acquisition III
Texas Ventures Acquisition III (TVA) registers an OpportunityRadar Score of 61, with a technical score of 69. The system issues a 'BUY' signal, carrying an 83% confidence rating and a 'STRONG ENTRY' recommendation. Its technical snapshot includes an RSI of 60.0 and a 'MACD BULL' signal, indicating positive momentum. TVA's recent performance shows a 0.32% return over the last month and a 1.0% gain over three months. The Risk/Reward ratio for TVA is 2.0.
Despite the 'STRONG ENTRY' signal and a high Risk/Reward ratio of 2.0, TVA's 1-month return of 0.32% and 3-month return of 1.0% are significantly lower than other stocks on this list. This suggests that while the risk-reward profile is favorable, the stock's actual price appreciation in the recent past has been minimal, which could indicate a slower-moving asset or a signal that is yet to translate into significant price movement.
#7: NEO — NeoGenomics, Inc.
NeoGenomics, Inc. (NEO) is highlighted with an OpportunityRadar Score of 61, driven by a technical score of 68. The stock receives a 'BUY' signal with 100% confidence and a 'STRONG ENTRY' recommendation. Its technical readings show an RSI of 63.8 and a 'MACD BULL' signal, indicating robust upward momentum. NEO has demonstrated strong performance, with a 16.73% return over the last month and an impressive 48.49% gain over three months. The Risk/Reward ratio for NEO is 0.5.
NEO's Risk/Reward ratio of 0.5 is a point of consideration, suggesting that the potential reward is relatively low compared to the risk. This is particularly relevant given its substantial 3-month return of 48.49% and 1-month return of 16.73%, which indicate that a significant portion of its potential upside might have already been realized, making further gains potentially more risk-intensive.
#8: ARE — Alexandria Real Estate Equitie
Alexandria Real Estate Equitie (ARE) shows an OpportunityRadar Score of 61, with a technical score of 64 and a fundamental score of 56. The system assigns a 'BUY' signal with an 83% confidence rating and a 'STRONG ENTRY' recommendation. Technical indicators include an RSI of 57.5 and a 'MACD BULL' signal. ARE's recent returns are 0.41% over the last month and 5.89% over three months. The Risk/Reward ratio for ARE is 0.6.
The Risk/Reward ratio of 0.6 for ARE is relatively low, indicating that the potential reward is modest in comparison to the risk. This, coupled with its relatively subdued 1-month return of 0.41% and 3-month return of 5.89% despite a 'STRONG ENTRY' signal, suggests that while the technical setup is positive, the stock may offer limited near-term upside relative to its risk profile.
#9: MGNI — Magnite, Inc.
Magnite, Inc. (MGNI) registers an OpportunityRadar Score of 61, with a technical score of 67. The stock is given a 'BUY' signal with 100% confidence and a 'STRONG ENTRY' designation. Its technical profile includes an RSI of 56.2 and a 'MACD BULL' signal, reflecting positive momentum. MGNI has seen a 4.12% return over the last month and a 34.12% gain over three months. The Risk/Reward ratio for MGNI is 0.9.
MGNI's Risk/Reward ratio of 0.9 is just below parity, suggesting that the potential reward is slightly less than the risk. While the 100% confidence and 'STRONG ENTRY' are compelling, this ratio, alongside a significant 3-month return of 34.12%, implies that a portion of the upward movement has already occurred, and future gains might come with a slightly less favorable risk-adjusted profile.
#10: HNST — The Honest Company, Inc.
The Honest Company, Inc. (HNST) completes our top 10 list with an OpportunityRadar Score of 61, driven by a technical score of 68. The system issues a 'BUY' signal with a 67% confidence rating and an 'ENTRY' recommendation. Its RSI is 51.9, but the MACD is in 'BEAR' territory. HNST has recorded a 2.6% return over the last month and a substantial 44.44% gain over three months. The Risk/Reward ratio for HNST is 2.0.
Despite its high Risk/Reward ratio of 2.0, HNST shows a MACD in 'BEAR' territory, which contrasts with its 'BUY' signal and positive 3-month return of 44.44%. This divergence in MACD suggests that while the long-term trend might be strong, recent momentum could be waning or consolidating. Additionally, the 67% confidence rating is lower than many other 'STRONG ENTRY' signals on the list, indicating less conviction from the system.
Key Observations Across the Scan
Across the 10 tickers highlighted in this scan, several patterns emerge. A notable 6 out of 10 stocks received a 100% confidence rating for their 'BUY' signals, indicating strong conviction from the OpportunityRadar system. Furthermore, 8 of the 10 tickers displayed a 'MACD BULL' signal, reinforcing the presence of positive momentum across a significant portion of these opportunities. The average RSI for these 10 stocks stands at 59.07, suggesting a healthy range of momentum without being excessively overbought. In terms of performance, 4 of the 10 tickers, including ECO, HSHP, TRVG, and NEO, delivered 1-month returns exceeding 10%, while 5 tickers, including ECO, HSHP, NEO, MGNI, and HNST, showed impressive 3-month returns greater than 30%.
Key Risk Factors
- Divergent MACD Signals: DoubleVerify Holdings, Inc. (DV) and The Honest Company, Inc. (HNST) both show a 'MACD BEAR' signal despite receiving overall 'BUY' signals. For DV, this is coupled with a 67% confidence, and for HNST, an RSI of 51.9. This divergence between the BUY signal and the MACD status could indicate weakening short-term momentum or consolidation, warranting closer monitoring.
- Lower Risk/Reward Ratios: Several tickers present relatively low Risk/Reward ratios, suggesting that the potential upside may not significantly outweigh the downside risk. Teva Pharmaceutical Industries (TEVA) has a ratio of 0.4, NeoGenomics, Inc. (NEO) at 0.5, Alexandria Real Estate Equitie (ARE) at 0.6, and Himalaya Shipping Ltd. (HSHP) at 0.7. These low ratios, particularly for stocks like NEO with a 3-month return of 48.49%, imply that much of the easy gains might have already been realized.
- Subdued Recent Returns Despite Strong Signals: Texas Ventures Acquisition III (TVA) and Alexandria Real Estate Equitie (ARE) both carry 'STRONG ENTRY' signals with 83% confidence, yet their 1-month returns are 0.32% and 0.41% respectively. This contrasts with other high-conviction signals showing double-digit 1-month gains, suggesting that while the technical setup may be present, the immediate price action has been modest.
About Our Methodology
OpportunityRadar scans 6,600+ US stocks daily using 15+ technical indicators including RSI, MACD, Bollinger Bands, ADX, Aroon, support/resistance levels, and volume analysis, combined with fundamental metrics. Stocks are scored 0-100 with signals ranging from Accumulate to Strong Buy. Entry confidence is rated 50-100% based on 6 confirmation factors.
Disclaimer: This article is for informational purposes only and does not constitute financial advice. Past performance does not guarantee future results. Always conduct your own research and consult a qualified financial advisor before making investment decisions. Data as of September 22, 2026.
Related Articles
Disclaimer : The above information is for general informational purposes only. All information on the Site is provided in good faith, however we make no representation or warranty of any kind, express or implied, regarding the accuracy, adequacy, validity, reliability, availability or completeness of any information on the Site.