
10 Stocks Flash Strong Buy Signals on July 2, 2026 Scan
MarketsHost.com's July 2, 2026 scanner reveals 10 stocks with BUY or STRONG BUY signals and 100% confidence, including FVN (Score 67) and UCTT (81.08% 3M return).
by Kowsalya
Published Jul 02, 2026 | Updated Jul 02, 2026 | 📖 10 min read
Article continues below advertisement

OpportunityRadar Highlights 10 Stocks with Strong Buy Signals on July 2, 2026
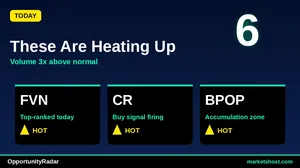
MarketsHost.com's proprietary OpportunityRadar scanner has identified a compelling set of equity signals for July 02, 2026, with Future Vision II Acquisition C (FVN) leading the pack with an OpportunityRadar Score of 67 and a STRONG BUY signal. This top-ranked ticker also boasts a 100% confidence rating, underpinned by a robust technical score of 80, even as its fundamental score sits at 47.
Today's scan reveals a consistent pattern of high conviction, with all of the top 10 profiled tickers receiving a 100% confidence rating for their BUY or STRONG BUY signals. Furthermore, every single one of these 10 stocks exhibits a MACD in BULL territory, indicating positive momentum. The average Relative Strength Index (RSI) across these top 10 signals is approximately 61.6, generally suggesting healthy upward price movement without yet entering extreme overbought conditions.
Top 10 Signals at a Glance
| # | Ticker | Company | Price | Score | Confidence | RSI | MACD | 1-Month Return |
|---|---|---|---|---|---|---|---|---|
| 1 | FVN | Future Vision II Acquisition C | $10.97 | 67 | 100% | 64.3 | BULL | 1.11% |
| 2 | CR | Crane Company | $216.16 | 66 | 100% | 62.9 | BULL | 16.16% |
| 3 | BPOP | Popular, Inc. | $165.87 | 66 | 100% | 64.1 | BULL | 11.98% |
| 4 | FBP | First BanCorp. New | $26.29 | 65 | 100% | 62.9 | BULL | 11.12% |
| 5 | BNED | Barnes & Noble Education, Inc | $12.60 | 65 | 100% | 58.9 | BULL | 22.62% |
| 6 | JPM | JP Morgan Chase & Co. | $333.43 | 65 | 100% | 62.5 | BULL | 10.83% |
| 7 | UCTT | Ultra Clean Holdings, Inc. | $114.37 | 64 | 100% | 53.3 | BULL | 23.58% |
| 8 | FFIV | F5, Inc. | $410.52 | 64 | 100% | 61.5 | BULL | 1.20% |
| 9 | BLBD | Blue Bird Corporation | $77.91 | 64 | 100% | 63.0 | BULL | 7.57% |
| 10 | BCRX | BioCryst Pharmaceuticals, Inc. | $9.60 | 64 | 100% | 56.9 | BULL | 16.36% |
#1: FVN — Future Vision II Acquisition C
Future Vision II Acquisition C (FVN) registers the highest OpportunityRadar Score at 67, earning a STRONG BUY signal with 100% confidence. Its technical score of 80 significantly outweighs its fundamental score of 47, suggesting that the current signal is heavily driven by market dynamics. The technical indicators show an RSI of 64.3 and a MACD in BULL territory, both aligning with a positive short-term outlook. The Risk/Reward ratio for FVN is noted at 1.9, indicating a favorable potential return relative to risk.
Despite the high overall score and STRONG BUY signal, FVN's recent performance metrics show more subdued returns compared to other high-scoring tickers. The 1-month return stands at 1.11%, while the 3-month return is 2.33%. This suggests that while the technical setup is strong, the stock has not yet translated this into significant short-term price appreciation, a point for investors to consider given the STRONG BUY classification.
#2: CR — Crane Company
Crane Company (CR) shows a strong performance on the OpportunityRadar scan, securing an overall score of 66 and a BUY signal with 100% confidence. Its technical score of 71 and fundamental score of 58 both contribute to this positive outlook. The stock's technical posture is reinforced by an RSI of 62.9 and a MACD in BULL status, indicating sustained upward momentum. CR has demonstrated robust price action, with a 1-month return of 16.16% and an impressive 3-month return of 28.67%.
A notable aspect for CR is its Risk/Reward ratio, which is currently at 0.5. This relatively low ratio suggests that the potential reward may be less significant compared to the inherent risk, especially when contrasted with tickers showing higher Risk/Reward figures. While the recent returns are strong, the lower Risk/Reward metric warrants careful consideration for those assessing entry points.
#3: BPOP — Popular, Inc.
Popular, Inc. (BPOP) is highlighted with an OpportunityRadar Score of 66 and a BUY signal, backed by a 100% confidence rating. The stock's technical score is 71, complemented by a fundamental score of 58. Its technical indicators, including an RSI of 64.1 and a MACD in BULL territory, point to a constructive price trend. BPOP has also delivered solid performance over recent periods, with a 1-month return of 11.98% and a 3-month return of 21.24%, demonstrating consistent upward movement.
The Risk/Reward ratio for BPOP is notably low at 0.2. This figure suggests that for every unit of risk taken, the potential reward is significantly smaller. While the stock's recent returns and strong technical signals are positive, the low Risk/Reward ratio indicates a less favorable risk-adjusted opportunity compared to other scanned equities, which could be a point of caution for risk-averse investors.
#4: FBP — First BanCorp. New
First BanCorp. New (FBP) registers an OpportunityRadar Score of 65, accompanied by a BUY signal and a 100% confidence level. The technical component of its score stands at 71, while its fundamental component is 56. Technical analysis shows an RSI of 62.9 and a MACD in BULL alignment, both consistent with a positive price trend. The stock has posted strong returns, with an 11.12% gain over the last month and a 20.93% increase over the last three months.
Similar to BPOP, FBP also presents a low Risk/Reward ratio of 0.2. This metric implies a limited upside potential relative to the downside risk. While the overall BUY signal and recent performance are robust, the constrained Risk/Reward ratio highlights a potential area for scrutiny for investors evaluating the attractiveness of this particular entry opportunity.
#5: BNED — Barnes & Noble Education, Inc
Barnes & Noble Education, Inc (BNED) is featured with an OpportunityRadar Score of 65 and a BUY signal, receiving a 100% confidence rating. The stock's technical score is 73, with its fundamental score at 53. Technically, BNED shows an RSI of 58.9 and a MACD in BULL territory, indicating a healthy upward trend. The performance metrics are particularly strong, with a 1-month return of 22.62% and an impressive 3-month return of 40.06%, making it one of the top performers in the scan for these periods.
BNED's Risk/Reward ratio is 1.7, which is a more favorable figure compared to several other tickers on this list, suggesting a better balance between potential gain and risk. The strong recent returns, combined with a positive technical setup and a reasonable Risk/Reward, position BNED as a potentially interesting opportunity, though investors should always consider the overall context of its OpportunityRadar scores.
#6: JPM — JP Morgan Chase & Co.
JP Morgan Chase & Co. (JPM) garners an OpportunityRadar Score of 65, signaling a BUY with 100% confidence. Notably, JPM exhibits a balanced profile with both its technical and fundamental scores at 65, indicating a consistent strength across both analytical dimensions. Its technical indicators include an RSI of 62.5 and a MACD in BULL status, reinforcing the positive signal. JPM has also shown solid price appreciation, with a 1-month return of 10.83% and a 3-month return of 13.18%.
The Risk/Reward ratio for JPM stands at 0.3. This relatively low figure, while not uncommon for larger, more established equities, suggests that the potential upside may be limited in proportion to the risk involved. Investors seeking higher risk-adjusted returns might find this ratio less appealing compared to opportunities with higher Risk/Reward metrics, despite the strong overall BUY signal and balanced score components.
#7: UCTT — Ultra Clean Holdings, Inc.
Ultra Clean Holdings, Inc. (UCTT) receives an OpportunityRadar Score of 64 and a BUY signal with a perfect 100% confidence. The technical score of 71 is considerably higher than its fundamental score of 53, indicating a strong technical impetus. UCTT's RSI is 53.3, and its MACD is in BULL territory, suggesting a healthy, non-overextended upward trend. The stock's returns are exceptional, with a 1-month gain of 23.58% and a remarkable 3-month gain of 81.08%, making it the top performer in the scan over the three-month period.
UCTT boasts the highest Risk/Reward ratio among the top 10 tickers at 2.0. This high ratio suggests a significant potential for reward relative to the risk taken. While the technical score is strong and recent performance has been outstanding, the divergence between its technical and fundamental scores might be a point of analysis for investors who prioritize a more balanced strength across both metrics.
#8: FFIV — F5, Inc.
F5, Inc. (FFIV) shows an OpportunityRadar Score of 64, earning a BUY signal with 100% confidence. Its technical score is 68, while its fundamental score is 58. The technical picture for FFIV includes an RSI of 61.5 and a MACD in BULL configuration, supporting the positive signal. Over the past three months, FFIV has seen a substantial return of 35.33%, although its 1-month return is more modest at 1.2%.
The Risk/Reward ratio for FFIV is 0.4. This relatively low ratio indicates that the potential reward may not be substantially greater than the risk assumed. While the long-term momentum, as reflected in the 3-month return, is strong, the more subdued 1-month return and the lower Risk/Reward ratio could suggest a period of consolidation or a less aggressive entry point compared to tickers with higher risk-adjusted potential.
#9: BLBD — Blue Bird Corporation
Blue Bird Corporation (BLBD) is identified with an OpportunityRadar Score of 64 and a BUY signal, carrying a 100% confidence rating. The stock's technical score is 69, with its fundamental score at 56. BLBD's technical indicators include an RSI of 63.0 and a MACD in BULL status, aligning with a positive trend. The company has delivered strong recent performance, with a 1-month return of 7.57% and a 3-month return of 32.89%.
BLBD's Risk/Reward ratio is 0.3, a lower figure that suggests a potentially limited upside relative to the risk involved. While the stock has demonstrated healthy returns over the past quarter and maintains a strong technical posture, the lower Risk/Reward ratio may prompt investors to evaluate the entry point carefully, especially those prioritizing opportunities with a more favorable risk-adjusted profile.
#10: BCRX — BioCryst Pharmaceuticals, Inc.
BioCryst Pharmaceuticals, Inc. (BCRX) completes our top 10 list with an OpportunityRadar Score of 64 and a BUY signal, accompanied by a 100% confidence rating. The stock's technical score is 69, with its fundamental score at 56. Technical analysis reveals an RSI of 56.9 and a MACD in BULL territory, indicating positive momentum. BCRX has shown a 1-month return of 16.36%, although its 3-month return is a more modest 6.43%.
BCRX's Risk/Reward ratio is 1.4, which is a relatively healthy figure, suggesting a more balanced potential for reward against risk compared to several other tickers in this scan. While the 1-month performance is strong, the lower 3-month return compared to some peers could suggest a more recent acceleration in price, which investors might consider in the context of the overall BUY signal.
Key Observations Across the Scan
Across the top 10 tickers identified by the OpportunityRadar scan, several consistent themes emerge. All 10 tickers received a 100% confidence rating for their BUY or STRONG BUY signals, indicating a high degree of conviction from the scanner's algorithms. Every single one of these stocks also displays a MACD in BULL territory, confirming broad positive momentum across this selection. The average RSI for these 10 tickers is approximately 61.6, generally suggesting healthy upward price action without being in extreme overbought territory.
Performance-wise, Ultra Clean Holdings, Inc. (UCTT) stands out with an impressive 3-month return of 81.08% and a 1-month return of 23.58%. Barnes & Noble Education, Inc (BNED) also delivered strong results with a 1-month return of 22.62% and a 3-month return of 40.06%. While many tickers showed strong returns, the Risk/Reward ratios varied significantly, with UCTT at 2.0 and FVN at 1.9 representing the highest, contrasting sharply with BPOP and FBP both at 0.2.
Key Risk Factors
- Several tickers, including Popular, Inc. (BPOP), First BanCorp. New (FBP), JP Morgan Chase & Co. (JPM), and Blue Bird Corporation (BLBD), exhibit notably low Risk/Reward ratios of 0.2, 0.2, 0.3, and 0.3 respectively. These low figures suggest that the potential upside may be limited in proportion to the downside risk, which could be a concern for investors prioritizing high risk-adjusted returns.
- Future Vision II Acquisition C (FVN), despite receiving a STRONG BUY signal and the highest overall OpportunityRadar Score of 67, shows relatively modest recent returns: a 1-month gain of 1.11% and a 3-month gain of 2.33%. This divergence between a strong signal and subdued short-term performance might warrant closer examination.
- While not yet in the overbought zone, several tickers display RSI values approaching the 70 mark. For instance, FVN (RSI 64.3), Popular, Inc. (BPOP) (RSI 64.1), and Blue Bird Corporation (BLBD) (RSI 63.0) have RSIs in the mid-60s. Such levels can sometimes precede short-term price consolidation or pullbacks, as strong upward movements may attract profit-taking.
About Our Methodology
OpportunityRadar scans 6,600+ US stocks daily using 15+ technical indicators including RSI, MACD, Bollinger Bands, ADX, Aroon, support/resistance levels, and volume analysis, combined with fundamental metrics. Stocks are scored 0-100 with signals ranging from Accumulate to Strong Buy. Entry confidence is rated 50-100% based on 6 confirmation factors.
Disclaimer: This article is for informational purposes only and does not constitute financial advice. Past performance does not guarantee future results. Always conduct your own research and consult a qualified financial advisor before making investment decisions. Data as of July 02, 2026.
Related Articles


Disclaimer : The above information is for general informational purposes only. All information on the Site is provided in good faith, however we make no representation or warranty of any kind, express or implied, regarding the accuracy, adequacy, validity, reliability, availability or completeness of any information on the Site.