10 Stocks Flash Buy Signals with Up to 100% Confidence — September 2026
Explore 10 US stocks, including Target and Deere, showing Buy signals from OpportunityRadar on Sept 15, 2026. Scores up to 68, confidence up to 100%.
by Kowsalya
Published Sep 15, 2026 | Updated Sep 15, 2026 | 📖 13 min read
Article continues below advertisement
OpportunityRadar Spotlights 10 Stocks with Strong Buy Signals and High Confidence
As of September 15, 2026, OpportunityRadar's daily scan has identified a compelling lineup of 10 US-listed stocks exhibiting 'BUY' signals, with several reaching the highest possible confidence rating of 100%. ScanSource, Inc. (SCSC), Elevance Health, Inc. (ELV), Deere & Company (DE), and HealthStream, Inc. (HSTM) all registered a perfect 100% confidence alongside a 'STRONG ENTRY' signal, indicating a robust alignment of underlying metrics. Topping the overall OpportunityRadar Score list is Target Corporation (TGT) with a score of 68, driven by a strong fundamental component of 75.
This concentrated set of signals reveals a dynamic market landscape where specific technical and fundamental factors are converging. Out of the 10 profiled tickers, four boast a 100% confidence rating, while two others, Journey Medical Corporation (DERM) and Cardiol Therapeutics Inc. (CRDL), achieved an impressive 83% confidence. The average Relative Strength Index (RSI) across these 10 stocks stands at approximately 56.11, suggesting a generally balanced, rather than overbought, market posture for many. The MACD indicator shows a split, with four tickers in bullish territory and six in bearish, highlighting varied momentum profiles even within 'BUY' signals.
Top 10 Signals at a Glance
| # | Ticker | Company | Price | Score | Confidence | RSI | MACD | 1-Month Return |
|---|---|---|---|---|---|---|---|---|
| 1 | TGT | Target Corporation | $154.24 | 68 | 67% | 45.6 | BEAR | 2.14% |
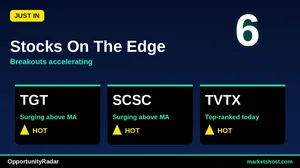
| 2 | SCSC | ScanSource, Inc. | $57.91 | 64 | 100% | 56.1 | BULL | 11.99% |
| 3 | TVTX | Travere Therapeutics, Inc. | $62.10 | 63 | 67% | 43.2 | BEAR | -2.25% |
| 4 | ELV | Elevance Health, Inc. | $419.61 | 63 | 100% | 60.2 | BULL | 7.53% |
| 5 | BWMN | Bowman Consulting Group Ltd. | $42.52 | 62 | 50% | 80.4 | BEAR | 0.35% |
| 6 | DE | Deere & Company | $681.68 | 62 | 100% | 62.6 | BULL | 13.63% |
| 7 | DERM | Journey Medical Corporation | $7.14 | 62 | 83% | 47.5 | BEAR | 10.50% |
| 8 | CRDL | Cardiol Therapeutics Inc. | $1.85 | 61 | 83% | 47.8 | BEAR | 2.78% |
| 9 | HSTM | HealthStream, Inc. | $29.86 | 61 | 100% | 60.1 | BULL | 6.57% |
| 10 | SLP | $18.40 | Simulations Plus, Inc. | 60 | 67% | 57.6 | BEAR | 0.22% |
#1: TGT — Target Corporation
Target Corporation (TGT) registers an OpportunityRadar Score of 68, the highest among the current scan's top entries. This score is notably bolstered by a strong fundamental component of 75, suggesting underlying financial strength. The technical score stands at 64. The platform issues a 'BUY' signal with a confidence rating of 67%, indicating a solid, though not absolute, conviction in the signal. TGT's current price is $154.24. Its Relative Strength Index (RSI) is 45.6, placing it in neutral territory, neither overbought nor oversold. However, the MACD indicator is currently in 'BEAR' territory, suggesting recent downward momentum despite the overall 'BUY' signal. Over the past month, TGT has seen a return of 2.14%, while its three-month return is a more substantial 15.62%, demonstrating recent upward price action.
A key factor to monitor for TGT is the divergence between its 'BUY' signal and the MACD 'BEAR' status. While the overall score and fundamental strength are positive, a bearish MACD suggests that recent price action might be losing upward momentum, which could present a short-term headwind despite the positive longer-term returns and OpportunityRadar Score. The Risk/Reward ratio is 1.6, indicating a moderate potential return for the assumed risk.
#2: SCSC — ScanSource, Inc.
ScanSource, Inc. (SCSC) stands out with an OpportunityRadar Score of 64, driven by a robust technical score of 71. The platform has issued a 'BUY' signal with the highest possible confidence rating of 100%, alongside a 'STRONG ENTRY' recommendation. This indicates a high degree of alignment across the various confirmation factors used by the scanner. SCSC's current price is $57.91. Its Relative Strength Index (RSI) is 56.1, maintaining a healthy neutral-to-strong position, and the MACD indicator is firmly in 'BULL' territory, reinforcing the positive momentum. The stock has demonstrated strong performance, with a 1-month return of 11.99% and an impressive 3-month return of 17.54%, reflecting consistent upward trajectory.
While SCSC exhibits strong bullish signals, investors should note its Risk/Reward ratio of 1.5. While positive, this ratio suggests that the potential reward is 1.5 times the assumed risk, which is solid but not as high as some other opportunities presenting a 2.0 ratio. This is a minor consideration given the 100% confidence and 'STRONG ENTRY' signal, but it's a number to keep in perspective when assessing overall trade potential.
#3: TVTX — Travere Therapeutics, Inc.
Travere Therapeutics, Inc. (TVTX) has generated an OpportunityRadar Score of 63, with a technical component of 67 and a fundamental component of 56. The scanner has issued a 'BUY' signal for TVTX, accompanied by a 67% confidence rating and an 'ENTRY' recommendation. The stock is currently priced at $62.10. Its Relative Strength Index (RSI) is 43.2, indicating that the stock is neither overbought nor oversold, residing in a neutral zone. However, the MACD indicator is currently in 'BEAR' territory, suggesting recent downward price pressure. Performance-wise, TVTX has experienced a -2.25% return over the last month, contrasting with a strong 16.34% return over the past three months, indicating a recent pullback after a period of significant gains.
The primary risk factor for TVTX lies in its recent 1-month return of -2.25% coupled with a MACD 'BEAR' signal, despite the overall 'BUY' recommendation. This suggests that while the longer-term trend (as seen in the 3-month return) might be positive, the immediate momentum is negative. Investors should consider this short-term weakness against the 67% confidence and the attractive Risk/Reward ratio of 2.0, which is among the highest in the current scan, implying a favorable potential return relative to risk if the trend reverses.
#4: ELV — Elevance Health, Inc.
Elevance Health, Inc. (ELV) has an OpportunityRadar Score of 63, with its technical component at 67 and fundamental score at 58. The scanner has flagged ELV with a 'BUY' signal, backed by a 100% confidence rating and a 'STRONG ENTRY' recommendation. This robust confidence level points to a high degree of confirmation across the various indicators. Currently, ELV trades at $419.61. Its Relative Strength Index (RSI) is 60.2, indicating healthy upward momentum without being in an extreme overbought condition. Furthermore, the MACD indicator is in 'BULL' territory, reinforcing the positive short-term trend. The stock has posted solid returns, with a 1-month gain of 7.53% and a 3-month gain of 5.48%, demonstrating consistent, albeit more moderate, upward price movement.
Despite the strong signals, ELV's Risk/Reward ratio is 1.1. While still positive, this is the lowest ratio among the top 10 'BUY' signals with 100% confidence, suggesting that the potential reward is only slightly higher than the assumed risk. Investors evaluating ELV should weigh this against the robust 100% confidence and 'STRONG ENTRY' signal, considering if the potential upside aligns with their individual risk tolerance given the relatively modest risk/reward profile.
#5: BWMN — Bowman Consulting Group Ltd.
Bowman Consulting Group Ltd. (BWMN) has an OpportunityRadar Score of 62, with a technical score of 68 and a fundamental score of 53. The scanner has issued a 'BUY' signal for BWMN, but with a lower confidence rating of 50% and a 'PARTIAL ENTRY' recommendation. The stock's current price is $42.52. A notable technical indicator is its Relative Strength Index (RSI) at 80.4, which is significantly above the 70 threshold, typically indicating an overbought condition. The MACD indicator is currently in 'BEAR' territory, suggesting a recent shift in momentum despite the high RSI. BWMN has seen a modest 0.35% return over the last month, but a substantial 35.67% gain over the past three months, reflecting strong longer-term performance followed by a period of consolidation.
The most prominent risk for BWMN is its extremely high RSI of 80.4. This level strongly suggests that the stock may be overextended in the short term and could be due for a pullback or consolidation, despite the 'BUY' signal. This is further complicated by the MACD being in 'BEAR' territory and the lower 50% confidence rating, advising a 'PARTIAL ENTRY.' The Risk/Reward of 2.0 is attractive, but the overbought condition warrants careful consideration.
#6: DE — Deere & Company
Deere & Company (DE) registers an OpportunityRadar Score of 62, with technicals at 65 and fundamentals at 58. The platform has identified a 'BUY' signal for DE, accompanied by a 100% confidence rating and a 'STRONG ENTRY' recommendation, underscoring a high degree of conviction in the signal. DE is currently trading at $681.68. Its Relative Strength Index (RSI) is 62.6, indicating healthy momentum without entering overbought territory. The MACD indicator is in 'BULL' territory, further supporting the positive trend. The stock has demonstrated strong recent performance, with a 1-month return of 13.63% and a 3-month return of 16.47%, highlighting consistent and robust upward price movement.
Despite the strong 'BUY' signal and 100% confidence, DE presents a notably low Risk/Reward ratio of 0.4. This indicates that the potential reward is significantly less than the assumed risk, which is a critical factor for investors to consider. While the technical alignment and recent returns are compelling, the low Risk/Reward ratio suggests that the potential upside may be limited relative to the downside exposure, warranting careful evaluation of entry and exit strategies.
#7: DERM — Journey Medical Corporation
Journey Medical Corporation (DERM) shows an OpportunityRadar Score of 62, with a strong technical component of 70 and a fundamental score of 50. The scanner has issued a 'BUY' signal for DERM, supported by a high confidence rating of 83% and a 'STRONG ENTRY' recommendation. The stock is currently priced at $7.14. Its Relative Strength Index (RSI) is 47.5, placing it in a neutral zone, indicating neither overbought nor oversold conditions. However, the MACD indicator is currently in 'BEAR' territory, suggesting recent negative momentum. Despite this, DERM has delivered positive recent performance, with a 1-month return of 10.5% and a 3-month return of 16.82%, demonstrating recent gains after a period of upward movement.
A potential risk for DERM is the MACD 'BEAR' signal, which contrasts with the 'STRONG ENTRY' recommendation and positive recent returns. While the 83% confidence is high, a bearish MACD suggests that the immediate upward momentum might be facing headwinds or undergoing a consolidation phase. Investors should monitor this technical divergence to ensure the underlying strength aligns with the 'BUY' signal and the 1.4 Risk/Reward ratio.
#8: CRDL — Cardiol Therapeutics Inc.
Cardiol Therapeutics Inc. (CRDL) has an OpportunityRadar Score of 61, with a technical score of 69 and a fundamental score of 50. The scanner has generated a 'BUY' signal for CRDL, accompanied by a strong 83% confidence rating and a 'STRONG ENTRY' recommendation. The stock's current price is $1.85. Its Relative Strength Index (RSI) is 47.8, indicating a neutral position, well within typical trading ranges. However, the MACD indicator is currently in 'BEAR' territory, suggesting recent downward pressure. Despite this, CRDL has shown impressive long-term performance, with a 3-month return of 74.53%, although its 1-month return is a more modest 2.78%, indicating a recent slowdown after significant gains.
The main risk for CRDL is the MACD 'BEAR' signal, which occurs despite the 'STRONG ENTRY' recommendation and the impressive 3-month return. This suggests that while the stock has seen substantial gains over the longer term, it may be experiencing a short-term correction or consolidation phase. Investors should evaluate this bearish momentum against the 83% confidence and the highly attractive Risk/Reward ratio of 2.0, which implies a strong potential return relative to the assumed risk.
#9: HSTM — HealthStream, Inc.
HealthStream, Inc. (HSTM) carries an OpportunityRadar Score of 61, with a technical component of 68 and a fundamental score of 50. The scanner has issued a 'BUY' signal for HSTM, backed by a 100% confidence rating and a 'STRONG ENTRY' recommendation. This reflects a high level of conviction in the signal. HSTM is currently priced at $29.86. Its Relative Strength Index (RSI) is 60.1, indicating healthy upward momentum without being in an overbought state. The MACD indicator is in 'BULL' territory, reinforcing the positive short-term trend. The stock has delivered consistent positive returns, with a 1-month gain of 6.57% and a 3-month gain of 15.83%, demonstrating a steady upward trajectory.
While HSTM shows strong bullish indicators, its Risk/Reward ratio stands at 1.2. This ratio, while positive, is on the lower end compared to some other 'BUY' signals, suggesting that the potential upside is only slightly greater than the assumed risk. Investors should consider this moderate Risk/Reward ratio in conjunction with the 100% confidence and 'STRONG ENTRY' signal to ensure it aligns with their investment objectives and risk appetite.
#10: SLP — Simulations Plus, Inc.
Simulations Plus, Inc. (SLP) rounds out the top 10 with an OpportunityRadar Score of 60, composed of a technical score of 64 and a fundamental score of 53. The platform has generated a 'BUY' signal for SLP, with a 67% confidence rating and an 'ENTRY' recommendation. The stock is currently trading at $18.40. Its Relative Strength Index (RSI) is 57.6, indicating a neutral to slightly bullish momentum without being overbought. However, the MACD indicator is in 'BEAR' territory, suggesting recent downward pressure. SLP's recent performance has been modest, with a 1-month return of 0.22% and a 3-month return of 0.88%, indicating a period of relatively flat price action.
A notable risk for SLP is the combination of its MACD 'BEAR' signal and relatively flat recent returns (0.22% over 1 month, 0.88% over 3 months), despite the 'BUY' signal. This suggests that while the scanner identifies a 'BUY' opportunity, the immediate price action has not been strongly bullish. Investors should weigh this lack of strong recent momentum against the 67% confidence and the attractive Risk/Reward ratio of 2.0, which indicates a favorable potential return relative to the assumed risk if a positive trend materializes.
Key Observations Across the Scan
- High Confidence Signals: Four of the ten profiled stocks—ScanSource, Inc. (SCSC), Elevance Health, Inc. (ELV), Deere & Company (DE), and HealthStream, Inc. (HSTM)—received the highest possible 100% confidence rating for their 'BUY' signals, all accompanied by a 'STRONG ENTRY' recommendation.
- Diverse Momentum: While all tickers carry a 'BUY' signal, the MACD indicator shows a split, with four stocks (SCSC, ELV, DE, HSTM) in 'BULL' territory, and six (TGT, TVTX, BWMN, DERM, CRDL, SLP) indicating 'BEAR' momentum.
- Strong Recent Performance: Three tickers demonstrated double-digit 1-month returns: Deere & Company (DE) at 13.63%, ScanSource, Inc. (SCSC) at 11.99%, and Journey Medical Corporation (DERM) at 10.5%.
- Exceptional Longer-Term Gains: Cardiol Therapeutics Inc. (CRDL) showed a remarkable 74.53% return over three months, and Bowman Consulting Group Ltd. (BWMN) delivered a 35.67% return over the same period.
- Attractive Risk/Reward: Four tickers—Travere Therapeutics, Inc. (TVTX), Bowman Consulting Group Ltd. (BWMN), Cardiol Therapeutics Inc. (CRDL), and Simulations Plus, Inc. (SLP)—exhibit a Risk/Reward ratio of 2.0, suggesting a favorable potential return relative to risk.
- RSI Levels: The average RSI across these 10 stocks is approximately 56.11, indicating that most are not in extreme overbought or oversold conditions, with the exception of Bowman Consulting Group Ltd. (BWMN) at 80.4.
Key Risk Factors
Despite the prevailing 'BUY' signals, several data points warrant careful consideration for investors:
- Overbought RSI: Bowman Consulting Group Ltd. (BWMN) shows a significantly high Relative Strength Index (RSI) of 80.4. This level often signals that a stock may be overextended in the short term and could be susceptible to a price correction or consolidation, despite its 3-month return of 35.67%.
- Low Risk/Reward Ratios: Deere & Company (DE) stands out with a very low Risk/Reward ratio of 0.4. While the stock has a 100% confidence 'STRONG ENTRY' signal and strong recent returns (13.63% 1-month, 16.47% 3-month), this ratio suggests that the potential upside may be limited relative to the downside risk, demanding a precise entry and exit strategy. Elevance Health, Inc. (ELV) and HealthStream, Inc. (HSTM) also present lower, though positive, Risk/Reward ratios of 1.1 and 1.2 respectively.
- MACD Divergence and Weak Recent Returns: Six of the ten profiled stocks (TGT, TVTX, BWMN, DERM, CRDL, SLP) show a MACD 'BEAR' signal despite their 'BUY' recommendations. For Travere Therapeutics, Inc. (TVTX), this is compounded by a negative 1-month return of -2.25%. Similarly, Simulations Plus, Inc. (SLP) has a MACD 'BEAR' signal alongside very modest 1-month (0.22%) and 3-month (0.88%) returns, indicating a lack of strong immediate bullish momentum.
About Our Methodology
OpportunityRadar scans 6,600+ US stocks daily using 15+ technical indicators including RSI, MACD, Bollinger Bands, ADX, Aroon, support/resistance levels, and volume analysis, combined with fundamental metrics. Stocks are scored 0-100 with signals ranging from Accumulate to Strong Buy. Entry confidence is rated 50-100% based on 6 confirmation factors.
Disclaimer: This article is for informational purposes only and does not constitute financial advice. Past performance does not guarantee future results. Always conduct your own research and consult a qualified financial advisor before making investment decisions. Data as of September 15, 2026.
Related Articles

Disclaimer : The above information is for general informational purposes only. All information on the Site is provided in good faith, however we make no representation or warranty of any kind, express or implied, regarding the accuracy, adequacy, validity, reliability, availability or completeness of any information on the Site.