
Top Stock Market Signals Today: Strong Buy, Sell & Breakout Stocks With Technical Analysis
Find today's top stock market signals with Strong Buy, Buy, Sell and Avoid recommendations. Explore RSI, MACD, trend analysis, support, resistance, entry zones, targets and risk levels for actively monitored stocks.
by Kowsalya
Published Sep 07, 2026 | Updated Sep 07, 2026 | 📖 8 min read
Article continues below advertisement
On This Page
- Top Stock Market Signals Today: Strong Buy, Sell & Breakout Stocks Based on Technical Analysis
- Today's Stock Market Technical Analysis: Quick Overview
- AI Overview: Today's Stock Signals Explained
- How Are Stock Market Signals Generated?
- Featured Snippet: What Are Strong Buy Stocks?
- Stock Market Signals Summary
- Important Note Before Using These Stock Signals
- Top Strong Buy Stocks Based on Technical Analysis
- Highest Ranked Momentum Stocks
- Stocks Showing Buy Signals
- Stocks Under Hold / Monitor Category
- Stocks Showing Sell or Avoid Signals
- Key Technical Indicators Used in Ranking
- How to Use These Stock Market Signals?
- Featured Snippet: What Is a Stock Entry Zone?
- Understanding Support, Targets and Stop Loss
- Risk Management Rules for Traders
- Market Signals: Important Observations
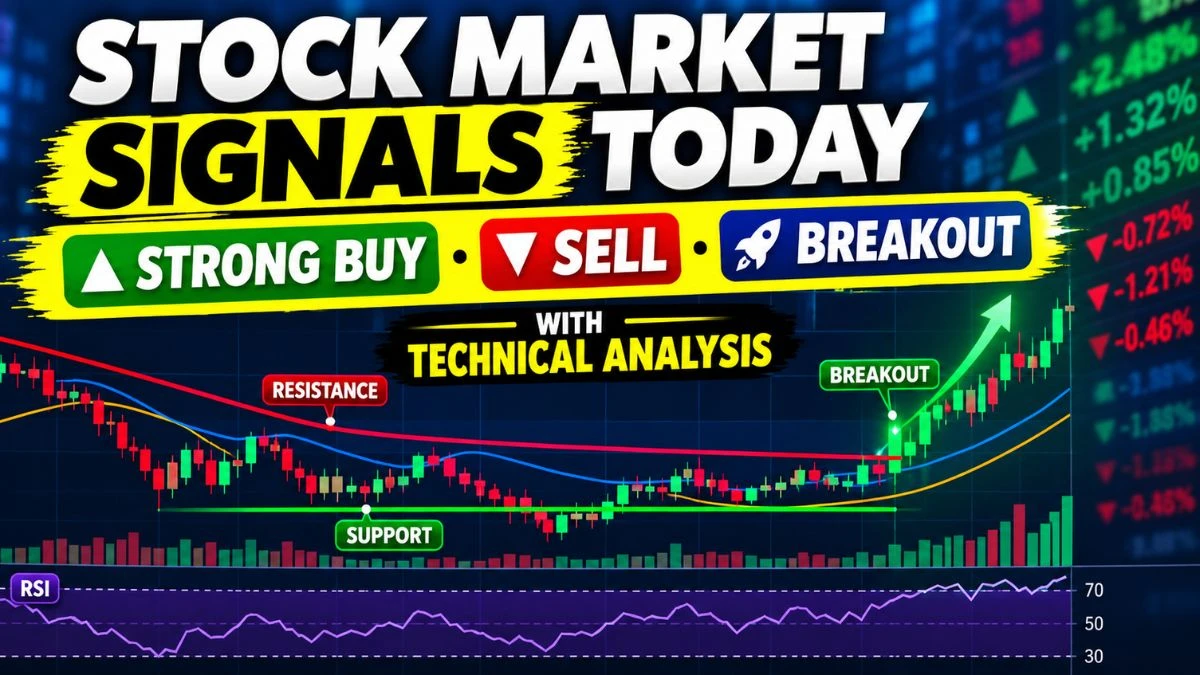
Top Stock Market Signals Today: Strong Buy, Sell & Breakout Stocks Based on Technical Analysis
Looking for the best stock market opportunities today? Our latest technical analysis identifies stocks showing strong bullish momentum, breakout potential, weakness, and trend reversal signals using indicators such as RSI, MACD, Stochastic, ADX, moving averages, volume trends, and price action.
The analysis highlights Strong Buy, Buy, Hold, Sell, and Avoid signals along with entry zones, support levels, targets, stop-loss levels, and risk-reward factors to help traders understand current market conditions.
Key takeaway: Stocks with improving momentum, positive trend indicators, rising volume, and strong technical scores are showing better upside potential, while stocks under strong downtrends should be approached cautiously.
Today's Stock Market Technical Analysis: Quick Overview
Technical indicators help traders identify possible buying opportunities, trend strength, and potential risks. The analysis below combines multiple indicators to generate a stock signal score and trading view.
| Analysis Factor | What It Indicates |
|---|---|
| RSI (Relative Strength Index) | Measures momentum and identifies overbought or oversold conditions. |
| MACD | Shows trend direction and possible momentum changes. |
| Stochastic %K | Helps identify short-term momentum strength. |
| ADX | Measures the strength of the current trend. |
| Moving Averages | Compares current price trends with 50-day and 200-day averages. |
| Volume & OBV | Shows buying or selling participation from traders. |
| Support & Resistance | Highlights important price levels for possible entries and exits. |
AI Overview: Today's Stock Signals Explained
According to the latest technical scan, several stocks are showing bullish momentum with Strong Buy signals, while some stocks remain under pressure due to weak trends and bearish indicators.
- Strong Buy Signals: Stocks with improving momentum, positive technical scores, rising volume confirmation, and breakout potential.
- Buy Signals: Stocks showing early recovery signs but requiring confirmation before aggressive entry.
- Hold / Monitor: Stocks where technical conditions are mixed and traders should wait for stronger confirmation.
- Sell Signals: Stocks showing weakness, negative momentum, or poor trend structure.
- Avoid Signals: Stocks under strong downtrend conditions where risk is higher.
How Are Stock Market Signals Generated?
The stock ranking system evaluates multiple technical indicators together instead of depending on a single signal. Each stock receives a score based on momentum, trend strength, volume behaviour, and risk-reward potential.
Factors Considered in Stock Ranking
- Price Momentum: Recent price performance and rate of change (ROC) are analysed to identify improving or weakening momentum.
- Trend Strength: ADX, moving averages, and directional indicators (+DI/-DI) determine whether a stock is trending or ranging.
- Momentum Indicators: RSI, MACD, and Stochastic signals are used to identify possible continuation or reversal patterns.
- Risk Management: Support levels, stop-loss zones, targets, and risk-reward ratios are considered before generating trade views.
- Volume Confirmation: OBV and volume trends help identify whether price movement is supported by market participation.
Featured Snippet: What Are Strong Buy Stocks?
Strong Buy stocks are shares showing multiple positive technical signals, including:
- Positive momentum and improving price action
- Strong technical score compared with other stocks
- Support from volume indicators
- Bullish trend structure
- Potential breakout or continuation pattern
Stock Market Signals Summary
| Signal | Meaning | Trading Approach |
|---|---|---|
| Strong Buy | Multiple bullish indicators are active | Watch for entry opportunities with risk control |
| Buy | Positive setup but confirmation may be required | Monitor entry levels |
| Hold | Mixed technical conditions | Wait for clearer direction |
| Sell | Weak momentum or declining trend | Avoid fresh positions |
| Avoid | Strong downside pressure | Stay cautious |
Important Note Before Using These Stock Signals
Technical analysis provides possible market scenarios based on historical price behaviour and indicators. Stock prices can change due to company results, economic conditions, market sentiment, and unexpected events.
Always combine technical analysis with your own research, risk management strategy, and investment objectives before making any trading decision.
Top Strong Buy Stocks Based on Technical Analysis
The latest technical scan identifies several stocks showing strong momentum, improving trends, and positive indicator alignment. These stocks have received higher technical scores based on momentum, volume confirmation, trend strength, and price structure.
Technical indicators such as RSI, MACD, moving averages, and volume trends are commonly used together to evaluate momentum and possible trend changes. :contentReference[oaicite:0]{index=0}
Strong Buy Stock Signals
| Stock | Price | Signal | Score | Trend | Entry Zone | Target | Stop Loss |
|---|---|---|---|---|---|---|---|
| RSKD | $6.51 | Strong Buy | 14 | Trending | $5.36 - $6.15 | $7.11 / $7.40 | $6.06 |
| SWI | $11.48 | Strong Buy | 13 | Trending | $11.04 - $11.33 | $11.76 / $11.90 | $11.27 |
| HCI | $187.64 | Strong Buy | 12 | Trending | $181.30 - $185.43 | $196.80 / $201.37 | $180.77 |
| AMWL | $12.99 | Strong Buy | 12 | Ranging | $11.26 - $12.38 | $14.53 / $15.30 | $11.83 |
| KRYS | $358.24 | Strong Buy | 12 | Ranging | $318.16 - $346.82 | $383.03 / $395.43 | $339.64 |
| UVE | $44.14 | Strong Buy | 11 | Ranging | $41.78 - $43.18 | $46.49 / $47.67 | $42.37 |
| MDGL | $541.08 | Strong Buy | 10 | Ranging | $502.11 - $528.84 | $579.43 / $598.61 | $512.32 |
| OSCR | $32.25 | Strong Buy | 10 | Ranging | $28.07 - $30.83 | $35.64 / $37.34 | $29.71 |
Highest Ranked Momentum Stocks
Some stocks are showing strong momentum because of improving price action, positive directional indicators, and volume support. However, traders should check entry levels because stocks that move sharply higher can also experience short-term pullbacks.
| Rank | Stock | Signal | Reason | Confidence |
|---|---|---|---|---|
| 1 | RSKD | Strong Buy | Volume confirmation with strong trend continuation | 88% |
| 2 | SWI | Strong Buy | High momentum with breakout structure | 65% |
| 3 | HCI | Strong Buy | Trend continuation setup | 88% |
| 4 | OSCR | Strong Buy | Momentum breakout signal | 47% |
| 5 | PCVX | Strong Buy | Positive trend and technical strength | 77% |
Stocks Showing Buy Signals
Stocks under the Buy category show improving technical conditions but may require additional confirmation before aggressive positions. Traders should monitor breakout levels, volume activity, and support zones.
| Stock | Price | Signal | Entry Zone | Target Levels |
|---|---|---|---|---|
| SIG | $85.30 | Buy | $76.30 - $85.62 | $88.17 / $94.48 |
| PLXS | $245.98 | Buy | $224.14 - $250.49 | $250.49 / $258.72 |
| WSFS | $79.37 | Buy | $76.66 - $79.67 | $82.16 / $83.56 |
| FFBC | $32.98 | Buy | $31.85 - $33.22 | $33.86 / $34.69 |
| RAMP | $37.75 | Buy | $37.51 - $37.72 | $38.04 / $38.18 |
| AVPT | $13.43 | Buy | $12.72 - $13.42 | $14.36 / $14.82 |
Stocks Under Hold / Monitor Category
Several stocks have mixed signals where bullish and bearish indicators are not fully aligned. These stocks require patience until stronger confirmation appears.
| Stock | Price | Signal | Observation |
|---|---|---|---|
| CORT | $111.62 | Hold | Waiting for stronger momentum confirmation |
| LNTH | $100.97 | Strong Buy (Monitor) | Possible breakout but confirmation required |
| CVCO | $566.19 | Hold | Mixed momentum signals |
| MSGS | $391.16 | Hold | Range-bound movement |
| EXPO | $68.35 | Hold | Waiting for trend clarity |
| UMBF | $143.76 | Hold | Technical confirmation pending |
Stocks Showing Sell or Avoid Signals
Stocks below show weaker technical structures due to bearish momentum, negative trend indicators, or price weakness compared with moving averages.
| Stock | Price | Signal | Reason |
|---|---|---|---|
| CALX | $35.96 | Strong Sell | Downtrend with weak momentum |
| FN | $407.40 | Strong Sell | Negative trend structure |
| HLIO | $71.62 | Strong Sell | Strong downtrend conditions |
| HIMS | $27.71 | Sell | Weak price momentum |
| CARG | $33.74 | Strong Sell | Bearish technical setup |
| PCOR | $58.01 | Strong Sell | Downtrend active |
Key Technical Indicators Used in Ranking
- RSI: Helps identify momentum strength and possible overbought or oversold conditions.
- MACD: Used to identify trend direction and momentum changes.
- ADX: Measures the strength of a trend.
- Moving Averages: Helps compare current prices with longer-term trend direction.
- OBV & MFI: Used to evaluate volume-based buying or selling pressure.
How to Use These Stock Market Signals?
Stock signals are designed to help traders identify potential opportunities by analysing price trends, momentum, volume behaviour, and technical patterns. However, no indicator can predict future market movements with complete accuracy.
Traders should use these signals as a research tool and combine them with proper risk management before taking any position.
Step-by-Step Approach for Using Stock Signals
- Check the Overall Trend:
Review trend indicators such as ADX, moving averages, and directional indicators before considering an entry. - Identify the Entry Zone:
Avoid chasing sharp price movements. Prefer buying near calculated entry zones or after confirmed breakouts. - Monitor Support Levels:
Support levels indicate areas where buying interest may appear and help define risk levels. - Set Stop Loss:
A stop-loss level helps limit potential losses if the trade moves against expectations. - Track Target Levels:
Target prices help traders plan possible profit-taking areas.
Featured Snippet: What Is a Stock Entry Zone?
A stock entry zone is a price range where technical analysis suggests a possible buying opportunity based on support levels, momentum, and market conditions.
- Entry zones are not guaranteed buying prices.
- Traders should wait for confirmation before entering.
- Volume and trend strength should support the setup.
- Risk should always be managed using stop-loss levels.
Understanding Support, Targets and Stop Loss
| Level | Purpose |
|---|---|
| Support 1 | First important price level where buying interest may appear. |
| Support 2 | Secondary support zone used for risk evaluation. |
| Entry Zone | Preferred price area for considering a trade setup. |
| Target 1 | First profit booking level. |
| Target 2 | Additional upside objective if momentum continues. |
| Target 3 | Longer-term price objective based on technical structure. |
| Stop Loss | Risk protection level to control downside. |
Risk Management Rules for Traders
Proper risk management is essential because even high-confidence technical setups can fail due to unexpected market movements.
- Avoid risking large portions of capital on a single trade.
- Use stop-loss levels consistently.
- Do not enter trades only because of a Strong Buy label.
- Consider market conditions, earnings, and company-specific news.
- Review technical signals regularly as prices change.
Market Signals: Important Observations
Positive Technical Trends
- Stocks with improving momentum are showing better short-term strength.
- Volume confirmation can increase confidence in breakout setups.
- Stocks trading above important moving averages generally indicate stronger trend conditions.
Warning Signs
- Weak RSI, negative MACD, and declining price action may indicate caution.
- Stocks below major moving averages may require additional confirmation.
- Poor risk-reward ratios can reduce the attractiveness of a trade setup.
Disclaimer: The information provided in this article is for educational and informational purposes only. The stock analysis, technical indicators, signals, entry zones, targets, and risk levels are generated based on available market data and should not be considered financial advice or a recommendation to buy or sell any security.
Market conditions can change rapidly due to economic events, company announcements, market sentiment, and other factors. Investors should conduct their own research, evaluate their financial situation, and consult a qualified financial advisor before making investment decisions.
Marketshost.com and its authors are not responsible for any financial losses arising from the use of this information. Trading and investing involve risk, and past performance does not guarantee future results.
Related Articles




Disclaimer : The above information is for general informational purposes only. All information on the Site is provided in good faith, however we make no representation or warranty of any kind, express or implied, regarding the accuracy, adequacy, validity, reliability, availability or completeness of any information on the Site.