
Top Stock Market Signals Today: 15 Stocks Showing Strong Buy Momentum, Breakouts & Technical Strength
Discover today's top stock market signals with Strong Buy stocks, breakout opportunities, technical analysis, RSI, MACD trends, momentum stocks, targets, and risk levels.
by Kowsalya
Published Jul 15, 2026 | Updated Jul 15, 2026 | 📖 4 min read
Article continues below advertisement
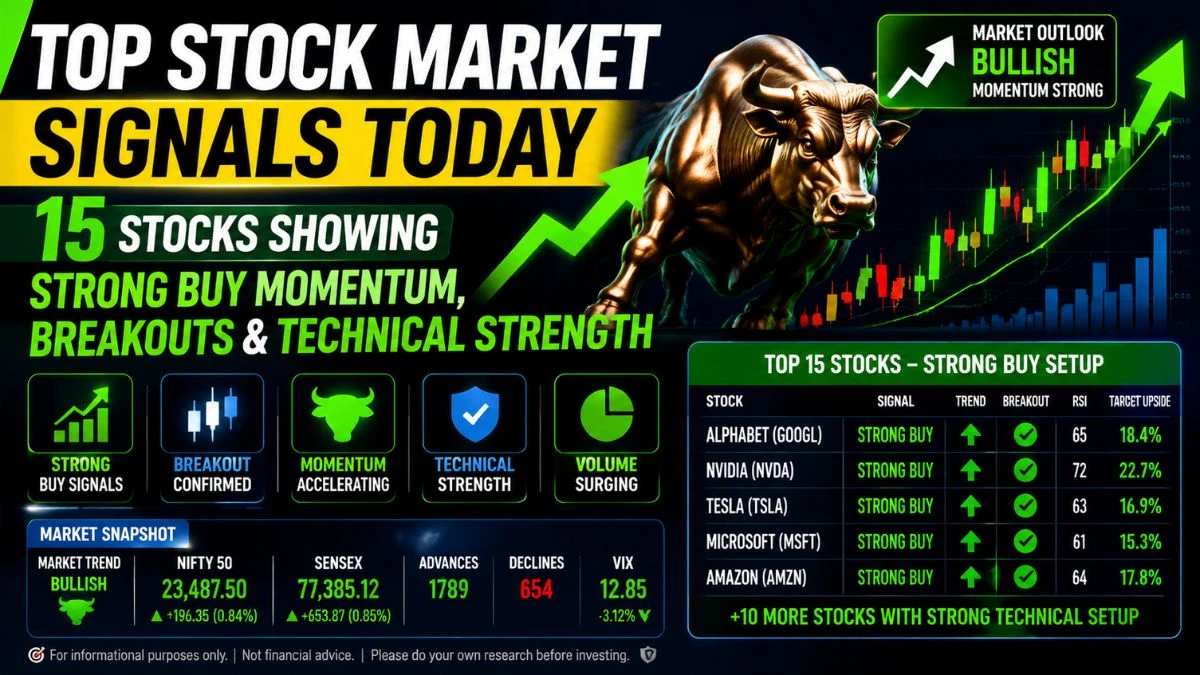
Several stocks are showing strong technical momentum based on RSI strength, MACD trends, volume activity, moving average signals, and breakout patterns. Stocks such as RAMP, AMWL, NWBI, UBI, UVE, HIMS, LMND, and GSHD are among the highest-ranked technical setups with strong scores, positive trend indicators, and improving price action.
The latest technical scan highlights stocks with Strong Buy signals, breakout opportunities, trend continuation setups, and volume-confirmed momentum. However, investors should evaluate risk, valuation, and market conditions before making any investment decisions.
Top Strong Buy Stocks Based on Technical Indicators
The following stocks received the highest technical scores based on momentum, trend strength, volume confirmation, and entry conditions.
| Stock | Price | Signal | Score | Confidence | Setup |
|---|---|---|---|---|---|
| RAMP | $37.94 | Strong Buy | 13 | 65% | Breakout Momentum |
| AMWL | $10.88 | Strong Buy | 13 | 77% | Trend Continuation |
| NWBI | $15.11 | Strong Buy | 11 | 77% | Breakout |
| UVE | $41.45 | Strong Buy | 11 | 88% | Trend Continuation |
| GSHD | $50.30 | Strong Buy | 11 | 88% | Volume Confirmed |
| HIMS | $35.15 | Strong Buy | 6 | 65% | Breakout |
| LMND | $70.14 | Strong Buy | 9 | 88% | Trend Continuation |
| FBP | $26.72 | Strong Buy | 9 | 65% | Breakout |
Highest-Ranked Breakout Stocks Showing Bullish Momentum
1. RAMP Stock Technical Analysis
Price: $37.94
Signal: Strong Buy
Rank: #1
Confidence: 65%
RAMP is showing one of the strongest technical setups in the current scan. The stock is trading above key moving averages with:
- RSI: 68.7 (approaching overbought zone)
- ADX: 39.1 indicating strong trend strength
- +DI: 37.5 vs -DI: 13.1 showing buyer dominance
- Golden Cross signal
- Price trading above Bollinger Band range
Technical View:
- Entry Type: Breakout
- Support Zone: $32.01
- Target 1: $38.54
- Target 2: $38.85
- Target 3: $47.53
- Stop Loss: $37.49
Key Risk: The stock has moved sharply and may require a pullback before fresh entries.
2. AMWL Stock Analysis: Strong Trend Continuation Setup
Price: $10.88
Signal: Strong Buy
Confidence: 77%
AMWL has emerged as a high-momentum stock with strong buying pressure.
Key Technical Indicators:
- RSI: 70.8 (Overbought)
- MACD: Bullish
- ADX: 34.6
- Money Flow Index: 85.8
- Price above SMA50 and SMA200
Technical Levels:
| Level | Price |
|---|---|
| Support 1 | $8.25 |
| Support 2 | $6.54 |
| Target 1 | $12.14 |
| Target 2 | $12.77 |
| Target 3 | $15.35 |
| Stop Loss | $9.94 |
Observation: Strong momentum continues, but traders should watch for profit booking due to elevated RSI.
3. NWBI Stock: Volume-Confirmed Breakout
Price: $15.11
Signal: Strong Buy
Rank: #4
NWBI is showing a strong technical structure supported by:
- RSI: 60.2
- ADX: 29.8
- Positive DI crossover
- Rising OBV trend
- Golden Cross formation
Important Levels:
- Entry Zone: $14.38 – $14.92
- Target 1: $15.62
- Target 2: $15.88
- Target 3: $17.61
- Stop Loss: $14.73
The stock remains technically positive with improving volume participation.
Top Momentum Stocks Near Breakout Zones
Stocks With Strong Buy Signals
| Stock | Price | RSI | Trend | Entry Type |
|---|---|---|---|---|
| UVE | $41.45 | 55.8 | Trending | Trend Continuation |
| GSHD | $50.30 | 57.0 | Trending | Volume Confirmed |
| LMND | $70.14 | 60.4 | Trending | Trend Continuation |
| HIMS | $35.15 | 58.0 | Trending | Breakout |
| CARG | $34.05 | 59.2 | Trending | Trend Continuation |
| OSCR | $31.07 | 61.0 | Trending | Breakout |
| RVMD | $184.97 | 62.6 | Trending | Breakout |
Stocks Showing Strong Trend Continuation Patterns
UVE Stock Analysis
UVE has one of the strongest setups with:
- Score: 11
- Confidence: 88%
- ADX: 32.6
- Rising OBV
- Positive DI crossover
Levels:
- Entry Zone: $36.82 – $40.69
- Target 1: $43.96
- Target 2: $45.21
- Target 3: $52.45
- Stop Loss: $39.57
LMND Stock Analysis
LMND continues to show strong momentum after a significant recovery.
Indicators:
- RSI: 60.4
- MACD: Bullish
- ADX: 29.5
- ROC: 25.3%
- Strong trend structure
Price Levels:
| Category | Price |
|---|---|
| Entry Zone | $50.67 – $65.10 |
| Target 1 | $78.30 |
| Target 2 | $82.38 |
| Target 3 | $96.57 |
| Stop Loss | $64.02 |
Stocks With Overbought Conditions: Watch Before Buying
Some stocks are technically strong but have moved into overbought territory.
| Stock | RSI | Condition | Action |
|---|---|---|---|
| AVPT | 74.4 | Overbought | Wait for pullback |
| NMIH | 74.0 | Overbought | Consider profit booking |
| PAYO | 75.1 | Overbought | Watch momentum |
| CPRX | 70.2 | Overbought | Avoid chasing |
Stocks Showing Weak Technical Structure
Several stocks remain under pressure due to weak momentum, negative MACD, and bearish trends.
| Stock | Signal | Reason |
|---|---|---|
| BOOT | Strong Sell | Downtrend active |
| SITE | Strong Sell | Below moving averages |
| FN | Strong Sell | Weak momentum |
| HLIO | Strong Sell | Bearish trend |
| MASI | Strong Sell | ADX confirms weakness |
| PRCT | Strong Sell | Heavy selling pressure |
Technical Indicators Explained: How These Stock Signals Are Generated
RSI (Relative Strength Index)
RSI measures price momentum:
- Above 70: Overbought condition
- 50–70: Positive momentum
- Below 30: Oversold condition
MACD Indicator
MACD identifies trend changes:
- Bullish MACD: Positive momentum
- Bearish MACD: Weakening trend
ADX Trend Strength
ADX measures the strength of a trend:
- Above 25: Strong trend
- Below 20: Weak trend
AI Overview: Key Takeaways From Today's Stock Scan
- RAMP, AMWL, NWBI, UVE, GSHD, and LMND are among the strongest technical setups.
- Stocks with rising ADX and positive DI crossover indicate improving trends.
- Several breakout stocks are showing volume confirmation.
- Overbought stocks require caution as short-term corrections are possible.
- Weak trend stocks should be avoided until technical improvement appears.
Disclaimer: The information provided in this article is for educational and informational purposes only and should not be considered financial advice, investment recommendations, or a solicitation to buy or sell any stock. Technical indicators, signals, targets, and price levels are based on available market data and may change with market conditions.
Investing in stocks involves risks, including possible loss of capital. Investors should conduct their own research, consider their financial objectives, and consult a qualified financial advisor before making investment decisions.
Marketshost.com and its contributors are not responsible for any losses or decisions made based on the information provided. Past performance does not guarantee future results.
Related Articles




Disclaimer : The above information is for general informational purposes only. All information on the Site is provided in good faith, however we make no representation or warranty of any kind, express or implied, regarding the accuracy, adequacy, validity, reliability, availability or completeness of any information on the Site.