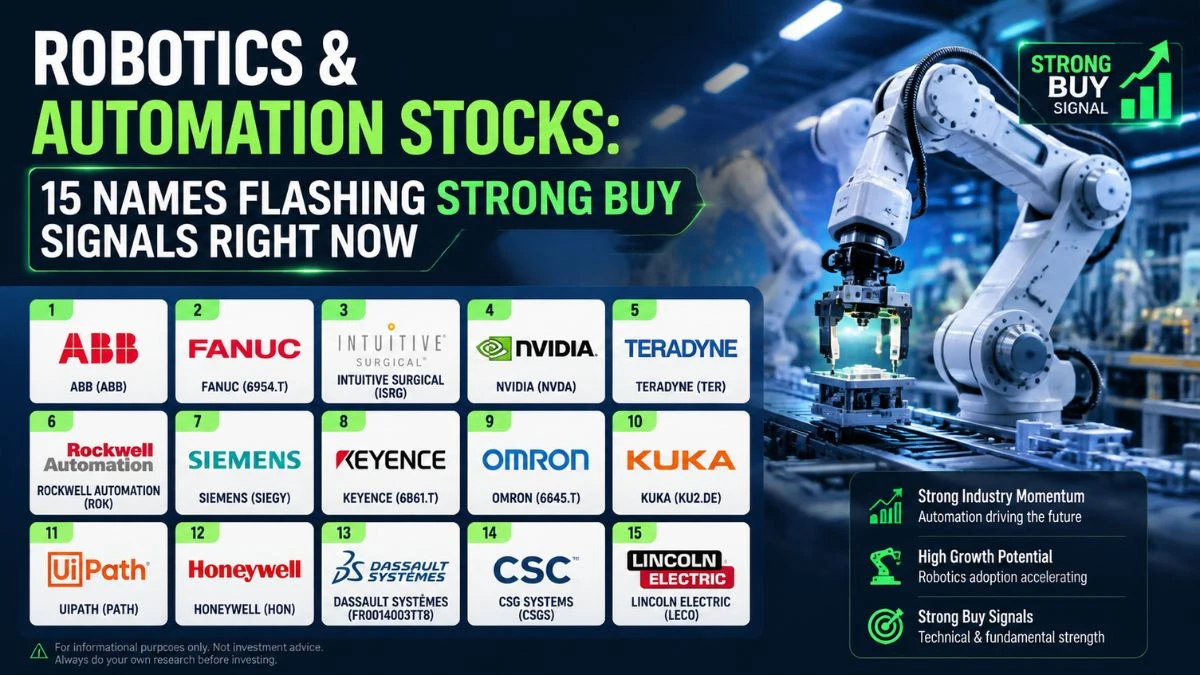
Robotics & Automation Stocks: 15 Names Flashing Strong Buy Signals Right Now
A technical screener flags 15 robotics, AI, and industrial-automation stocks with Strong Buy signals right now - plus 7 names showing exit warnings.
by Kowsalya
Published Aug 06, 2026 | Updated Aug 06, 2026 | 📖 5 min read
Article continues below advertisement
A technical screener across 90+ robotics, AI-automation, and industrial-tech tickers just flagged a cluster of "Strong Buy" setups - and an equally important list of stocks to avoid.
Quick answer: Running a multi-factor technical scan (RSI, MACD, ADX, moving averages, and volume) across the robotics and industrial-automation sector surfaced 15 stocks scoring "Strong Buy," led by Sif Holding (SIF), Glaukos (GKOS), and Hightower Tech ETF (HTEC). On the flip side, seven names - including Masimo (MASI), ON Semiconductor (ON), and MicroVision (MVIS) - are showing "Strong Sell" signals with active downtrends.
How This Screener Works
Instead of relying on a single indicator, this scan scores each stock from -15 to +15 using a blend of momentum, trend, and volume signals:
- RSI & Stochastic - measures whether a stock is overbought or oversold
- MACD histogram - flags bullish or bearish momentum shifts
- ADX & Directional Index (+DI/-DI) - confirms whether a trend is strong or just "ranging"
- Moving average crosses - Golden Cross (bullish, 50-day above 200-day) vs. Death Cross (bearish)
- OBV & MFI - checks if volume is actually confirming the price move
Stocks are then tagged with an entry type (breakout, momentum, or trend continuation), a confidence percentage, and a risk/reward ratio comparing potential upside to the distance to the stop-loss.
Top 10 Stocks With the Strongest Buy Signals
These names posted the highest composite scores in the scan, meaning multiple indicators are aligned in the same bullish direction - though several are now overbought enough to warrant a tighter stop rather than a fresh entry.
| Ticker | Price | Score | Signal | RSI | Trend Cross | Current Guidance |
|---|---|---|---|---|---|---|
| SIF | $27.06 | 15 | Strong Buy | 62.6 | Golden | Tighten stop (RSI approaching overbought) |
| GKOS | $170.93 | 13 | Strong Buy | 73.8 | Golden | Tighten stop - RSI 74 |
| HTEC | $39.85 | 13 | Strong Buy | 69.3 | Golden | Tighten stop - RSI 69 |
| MANH | $192.08 | 12 | Strong Buy | 66.8 | Death* | Tighten stop - RSI 67 |
| EMR | $162.47 | 11 | Strong Buy | 72.5 | Golden | Take profit - overbought |
| AME | $254.76 | 11 | Strong Buy | 69.8 | Golden | Tighten stop - RSI 70 |
| TDY | $683.73 | 11 | Strong Buy | 66.5 | Golden | Tighten stop - RSI 67 |
| ZBRA | $368.99 | 11 | Strong Buy | 85.2 | Golden | Take profit - deeply overbought |
| LFUS | $461.16 | 11 | Strong Buy | 62.3 | Golden | Tighten stop - RSI 62 |
| AZTA | $31.82 | 11 | Strong Buy | 74.2 | Death* | Take profit - RSI 74 |
*A "Death Cross" alongside a Strong Buy score reflects a longer-term average lag; short-term momentum indicators are still aligned bullish in these cases.
What Stands Out
- Overbought, not broken. Most of the top-scoring names - ZBRA, GKOS, AZTA, ITRI, EMR - have RSI readings above 70, meaning the screener's own guidance shifts from "buy the breakout" to "protect the gains" (tighten stop or take partial profit).
- Volume is confirming the moves. Every stock in the top 10 shows "Volume confirms – high conviction" as its action note, meaning On-Balance Volume and Money Flow Index are rising in step with price, not diverging from it.
- Golden Crosses dominate. 8 of the top 10 are trading above both their 50-day and 200-day moving averages in a confirmed uptrend structure.
Stocks Flashing Strong Sell / Exit Signals
Heads up: These seven stocks scored -6 or lower, with the screener explicitly labeling them "Strong downtrend - avoid" and recommending an immediate exit for existing positions.
| Ticker | Price | Score | ADX (Trend Strength) | Reason Flagged |
|---|---|---|---|---|
| OFIX | $10.42 | -11 | 27.7 | Score -11, confirmed downtrend |
| MASI | $4.22 | -11 | 48.1 | Score -11, ADX 48 confirms downtrend |
| MVIS | $3.18 | -10 | 16.1 | 13% single-day drop, oversold RSI 30.8 |
| AITX | $0.01 | -8 | 63.0 | Strongest ADX reading in the dataset - powerful downtrend |
| ON | $76.91 | -8 | 24.4 | Stochastic at 2.1 - deeply oversold, no reversal confirmed yet |
| BRKR | $52.47 | -8 | 28.0 | Price below both key moving averages |
| INVZ | $0.40 | -6 | 22.2 | 1-month return of -42% |
Sector Snapshot: Robotics, AI, and Industrial Automation
This basket spans surgical robotics, warehouse automation, lidar/sensing, semiconductor equipment, and industrial process-control names. A few patterns emerge across the full data set:
- Semiconductor equipment names are mixed. ENTG, CGNX, and NOVT show Strong Buy scores, while DIOD, NVMI, and AOSL are lagging with weaker momentum and bearish directional readings.
- Small-cap robotics plays are volatile. Names like RCAT, KSCP, and OSS carry historical volatility above 90%, more than triple that of large-cap peers like EMR or AME.
- Lidar and sensing stocks are split. AEVA and OUST both show Strong Buy momentum, while MVIS is in a confirmed downtrend and INVZ is deeply oversold without a reversal signal.
The technical backdrop for robotics and automation stocks is broadly constructive: the majority of names carrying Strong Buy scores also show volume confirmation and confirmed uptrends. But with several leaders - ZBRA, GKOS, AZTA, ITRI - now overbought, the screener's own guidance leans toward risk management (tightening stops, taking partial profits) rather than fresh breakout entries at current prices. On the other side, the seven Strong Sell names share a common thread: price trading below key moving averages with volume failing to confirm any bounce.
Disclaimer: This article is for informational and educational purposes only and is based on technical indicator data at a single point in time. It is not financial or investment advice, and Marketshost.com is not a licensed financial advisor. Technical scores, price targets, and stop-loss levels can change rapidly and should not be the sole basis for any investment decision. Always conduct your own research or consult a licensed financial professional before trading.
Related Articles
Robotics & Automation Stocks - FAQs
1. What does a "Golden Cross" mean in this screener?
A Golden Cross occurs when a stock's 50-day moving average moves above its 200-day moving average, generally read as a longer-term bullish trend signal. A "Death Cross" is the opposite — the 50-day average falling below the 200-day.
2. Why do some "Strong Buy" stocks say "Take Profit" or "Tighten Stop"?
A high composite score reflects the trend and volume backdrop, but it doesn't override short-term overbought readings. When RSI climbs above roughly 70, the screener's exit logic shifts toward protecting gains rather than chasing a stretched breakout.
3. What is Risk/Reward (R:R) ratio, and why do most setups show below 1.5:1?
R:R compares potential profit to the distance between entry price and stop-loss. Most setups in this scan cluster around 1.3:1, meaning the reward is only slightly larger than the risk — a signal that entries here favor tight risk management over large position sizing.
4. Which stock had the single highest technical score?
Sif Holding (SIF) topped the scan with a score of 15 out of a possible range of -15 to +15, driven by a Golden Cross, rising On-Balance Volume, and confirmed trend strength (ADX 25.7).
Disclaimer : The above information is for general informational purposes only. All information on the Site is provided in good faith, however we make no representation or warranty of any kind, express or implied, regarding the accuracy, adequacy, validity, reliability, availability or completeness of any information on the Site.