
Top Momentum Stocks Today 2026: Breakout Signals, Buy Zones, and Technical Market Analysis Across High-Growth Stocks
A complete technical analysis of top momentum stocks including META, GOOGL, RDDT, PINS, and more. Discover breakout signals, RSI trends, MACD strength, and actionable buy/sell insights for 2026.
by Kowsalya
Published Jul 06, 2026 | Updated Jul 06, 2026 | 📖 4 min read
Article continues below advertisement
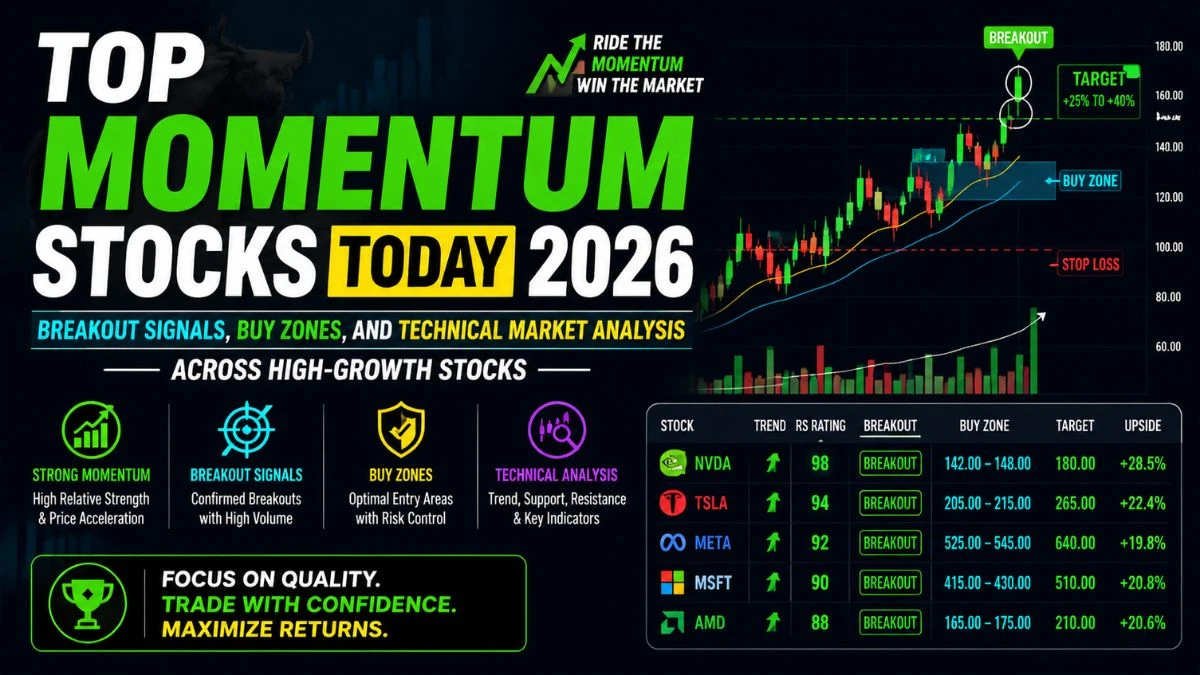
The latest technical scan of high-growth and momentum stocks shows a mixed but opportunity-rich market environment. While several stocks are showing strong breakout momentum supported by volume, RSI strength, and bullish MACD signals, others are struggling with poor risk-reward setups despite short-term strength.
Key leaders like Reddit (RDDT), Pinterest (PINS), Meta (META), and The Trade Desk (TTD) are showing active institutional interest, while some large-cap names such as Alphabet (GOOGL) are still in consolidation phases. At the same time, several overbought stocks are approaching short-term exhaustion levels, suggesting selective profit booking.
This analysis highlights actionable zones, trend strength, and entry quality based on multi-indicator confirmation.
Market Overview: What the Technical Data Shows
The current market structure across momentum stocks can be summarized into three key conditions:
- Breakout continuation in mid-cap growth stocks
- Overbought conditions in several high-beta names
- Consolidation in mega-cap tech stocks
Overall sentiment remains cautiously bullish, but risk management is critical due to stretched valuations in multiple names.
Strong Breakout Stocks (High Conviction Momentum)
These stocks show strong alignment across RSI, MACD, OBV, and volume confirmation:
Top Momentum Leaders
- RDDT (Reddit) – Strong institutional volume, breakout trend continuation
- PINS (Pinterest) – High volume breakout with improving OBV
- MGNI (Magnite) – Strong advertising demand momentum
- APPS (Digital Turbine) – Multi-month trend continuation
- CARG (CarGurus) – Sustained bullish structure with strong volume
- GRPN (Groupon) – Strong reversal-to-uptrend continuation
- ROKU (Roku) – Long-term recovery breakout confirmed
- SPOT (Spotify) – Consolidation breakout with improving structure
Key Insight
Most breakout stocks are in advertising, media, and digital platform sectors, showing renewed sector rotation into digital ad spending and consumer tech recovery.
Large-Cap Tech: Consolidation Phase
META (Meta Platforms)
- RSI: Neutral (49.6)
- Trend: Range-bound
- Signal: BUY but weak risk-reward
Meta is stabilizing after a pullback, but lacks strong directional momentum. Institutional accumulation is visible, but entry quality remains moderate.
GOOGL (Alphabet)
- RSI: Neutral (~49.5)
- Structure: Sideways consolidation
- Signal: Wait phase
Alphabet is building a base, but momentum is not yet confirmed for breakout continuation.
Overbought Stocks (Short-Term Caution Zone)
These stocks show strong momentum but elevated RSI levels:
- RDDT – Overbought but still trending
- PINS – High RSI with breakout continuation
- MGNI – Extended momentum phase
- APPS – Overheated rally
- GRPN – Strong rally but stretched
- COMP / QNST / CUEN – Extreme momentum spikes
Key Insight
These stocks remain bullish but are vulnerable to:
- Short-term pullbacks
- Profit booking
- Mean reversion corrections
Weak or High-Risk Stocks
These names show weak structure or poor risk-reward:
- SNAP – Weak trend, bearish structure
- NFLX – Early momentum but no confirmation
- PEGA – Downtrend pressure
- SSTK – Strong downtrend (avoid)
- DOCN – Heavy breakdown with strong selling pressure
- TASK – Weak momentum continuation
Key Insight
Avoid aggressive entries in weak ADX + negative trend alignment setups.
AI Overview: Market Structure Summary
The market is currently divided into three clear zones:
- Breakout Momentum Stocks – Strong volume-backed rallies (RDDT, PINS, MGNI)
- Consolidation Stocks – Waiting for directional breakout (META, GOOGL, SHOP)
- Weak Trend Stocks – Downtrend or poor structure (SSTK, DOCN, SNAP)
Overall, the market favors selective momentum trading rather than broad-based buying.
Best Stocks to Watch Right Now
Top Buy Candidates (High Momentum)
- RDDT
- PINS
- MGNI
- APPS
- ROKU
- SPOT
- GRPN
Wait / Monitor
- META
- GOOGL
- HUBS
- BILL
Avoid / Weak Trend
- SSTK
- DOCN
- SNAP
- TASK
Key Indicators Driving This Market
1. RSI (Relative Strength Index)
- Overbought in most breakout stocks
- Neutral in mega-cap tech
- Oversold in select weak names
2. MACD
- Strong bullish cross in growth stocks
- Early reversal signals in weak stocks
3. Volume & OBV
- Primary confirmation factor in breakout stocks
- Institutional accumulation clearly visible in RDDT, PINS, MGNI
4. Trend Strength (ADX)
- Strong ADX confirms trending stocks
- Weak ADX suggests consolidation or range-bound behavior
The current market is not a broad rally-it is a selective momentum-driven environment. The strongest opportunities are concentrated in high-growth digital platforms, ad-tech, and consumer internet stocks.
Traders should prioritize:
- Breakout confirmation with volume
- Strong ADX + bullish MACD alignment
- Avoiding overbought exhaustion zones without pullback
Disclaimer: This article is for informational and educational purposes only. It does not constitute financial advice, investment recommendation, or stock buying/selling guidance. Stock markets are subject to risk, and past performance is not indicative of future results. Always conduct your own research or consult a qualified financial advisor before making investment decisions.
Related Articles




Disclaimer : The above information is for general informational purposes only. All information on the Site is provided in good faith, however we make no representation or warranty of any kind, express or implied, regarding the accuracy, adequacy, validity, reliability, availability or completeness of any information on the Site.