
10 Stocks with Strong Buy Signals and High Momentum — August 2026
Explore 10 top-rated stocks for August 2026, including LAD with a 68 OpportunityRadar Score and 100% confidence, and PAYO with a 45.01% 3-month return.
by Kowsalya
Published Aug 04, 2026 | Updated Aug 04, 2026 | 📖 11 min read
Article continues below advertisement
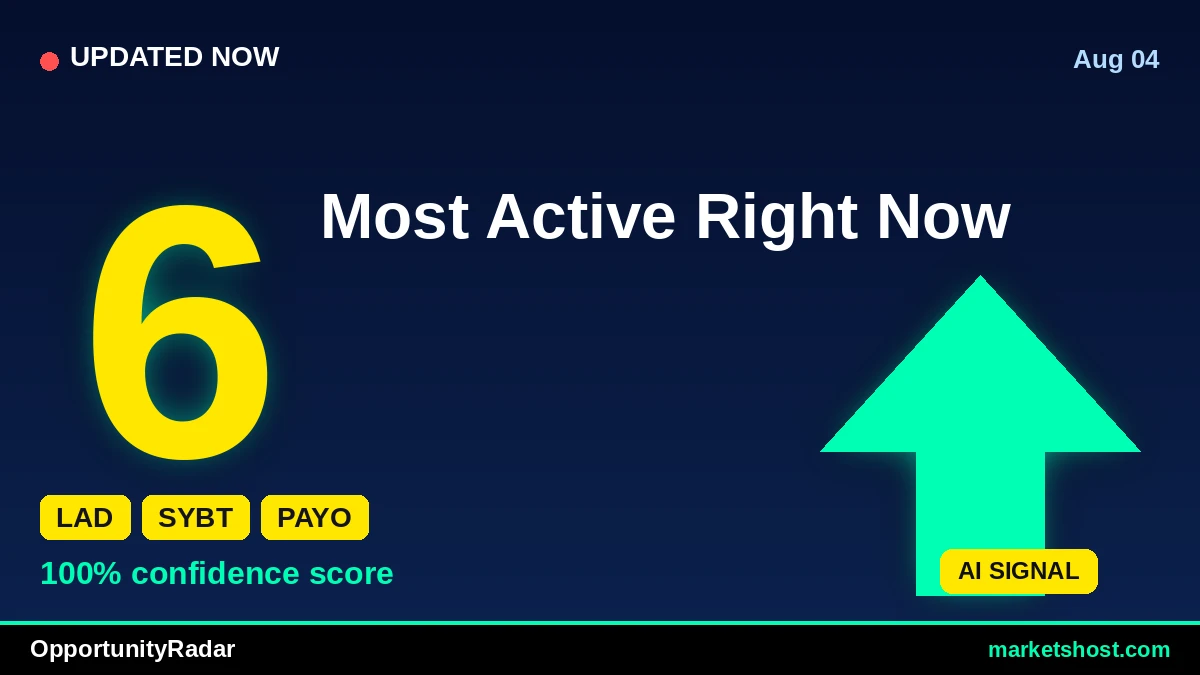
OpportunityRadar Spotlights 10 Strong Buy Candidates for August 2026
As August 2026 unfolds, the latest OpportunityRadar scan reveals a compelling set of equity signals, with Lithia Motors, Inc. (LAD) leading the pack. LAD boasts the highest OpportunityRadar Score of 68, underpinned by a robust technical score of 76 and a 100% confidence rating for its STRONG BUY signal. This strong conviction is further supported by significant price appreciation, with LAD recording an 18.59% return over the last month and a 29.01% gain over three months, alongside a BULL MACD signal and an RSI of 58.8.
The current scan highlights a strong bullish sentiment across multiple tickers. Out of the top 10 identified, seven stocks—LAD, SYBT, IBCP, MMM, NWS, KNSA, and WKC—are presenting with a perfect 100% confidence rating for their respective BUY or STRONG BUY signals. The technical landscape appears generally favorable, with nine of the ten profiled tickers showing a MACD BULL signal, indicating positive momentum. The average Relative Strength Index (RSI) across these ten tickers stands at approximately 63.13, suggesting a healthy upward trend without broadly entering overbought territory, though individual tickers warrant closer examination.
Top 10 Signals at a Glance
| # | Ticker | Company | Price | Score | Confidence | RSI | MACD | 1-Month Return |
|---|---|---|---|---|---|---|---|---|
| 1 | LAD | Lithia Motors, Inc. | $369.64 | 68 | 100% | 58.8 | BULL | 18.59% |
| 2 | SYBT | Stock Yards Bancorp, Inc. | $84.82 | 65 | 100% | 63.9 | BULL | 10.62% |
| 3 | PAYO | Payoneer Global Inc. | $7.12 | 64 | 67% | 65.0 | BEAR | 0.28% |
| 4 | IBCP | Independent Bank Corporation | $38.36 | 64 | 100% | 63.4 | BULL | 7.27% |
| 5 | MMM | 3M Company | $178.85 | 64 | 100% | 67.5 | BULL | 13.19% |
| 6 | IQV | IQVIA Holdings, Inc. | $228.10 | 64 | 83% | 61.5 | BULL | 9.54% |
| 7 | NWS | News Corporation | $31.96 | 63 | 100% | 56.5 | BULL | 4.89% |
| 8 | KNSA | Kiniksa Pharmaceuticals Intern | $75.10 | 63 | 100% | 64.4 | BULL | 11.61% |
| 9 | SHEL | Shell PLC | $89.48 | 63 | 83% | 61.0 | BULL | 9.14% |
| 10 | WKC | World Kinect Corporation | $39.09 | 63 | 100% | 69.3 | BULL | 18.03% |
#1: LAD — Lithia Motors, Inc.
Lithia Motors, Inc. (LAD) stands out with the highest OpportunityRadar Score in this scan at 68, driven by a strong technical score of 76. The system issues a STRONG BUY signal with a perfect 100% confidence, indicating a high degree of alignment across its internal metrics. LAD's technical indicators support this positive outlook, with a Relative Strength Index (RSI) of 58.8 and a MACD in BULL territory. The stock has demonstrated significant price momentum, returning 18.59% over the past month and an impressive 29.01% over the last three months, trading at a price of $369.64.
While the overall signal for LAD is robust, investors should note the Risk/Reward ratio of 1.9. This ratio suggests that the potential reward is nearly double the potential risk, which is a favorable characteristic for a STRONG BUY signal. However, the absence of specific stop levels, price targets, and detailed fundamental metrics in the current data means that further individual assessment would be necessary to establish precise risk management parameters beyond the provided ratio.
#2: SYBT — Stock Yards Bancorp, Inc.
Stock Yards Bancorp, Inc. (SYBT) presents a compelling profile with an OpportunityRadar Score of 65, backed by a technical score of 71 and a fundamental score of 56. The scanner has issued a BUY signal with 100% confidence, marking a STRONG ENTRY point. Technical indicators for SYBT are positive, showing an RSI of 63.9 and a MACD in BULL territory. The stock has posted solid returns, gaining 10.62% in the last month and 17.54% over the past three months, with its current price at $84.82.
A notable aspect for SYBT is its Risk/Reward ratio of 0.5. This indicates that the potential reward is half the potential risk, which is a less favorable ratio compared to some other tickers on the list. Despite the high confidence and strong technical signals, this lower Risk/Reward ratio suggests that the potential downside might be greater relative to the upside potential, a factor that merits consideration for risk-averse investors.
#3: PAYO — Payoneer Global Inc.
Payoneer Global Inc. (PAYO) registers an OpportunityRadar Score of 64, with its technical score at 69 and fundamental score at 56. The signal is a BUY, but with a confidence rating of 67%, indicating a moderate level of conviction compared to the 100% confidence seen in other top tickers. The entry signal is classified as ENTRY. PAYO's price is $7.12. While its 1-month return is a modest 0.28%, it has delivered a significant 45.01% return over the last three months, making it the strongest 3-month performer on this list.
Despite the impressive three-month performance, a key technical divergence for PAYO is its MACD, which is currently in BEAR territory, contrasting with the BUY signal. This bearish MACD, coupled with an RSI of 65.0 and the lower confidence rating of 67%, suggests that while there has been recent strong price action, the underlying momentum might be showing signs of weakening or indecision. The Risk/Reward ratio of 1.9, however, suggests a favorable balance of potential upside relative to downside.
#4: IBCP — Independent Bank Corporation
Independent Bank Corporation (IBCP) holds an OpportunityRadar Score of 64, with a technical score of 71 and a fundamental score of 53. The scanner identifies a BUY signal with 100% confidence and a STRONG ENTRY point. The stock's current price is $38.36. Technical indicators are aligned positively, featuring an RSI of 63.4 and a MACD in BULL territory. IBCP has shown consistent upward movement, with a 7.27% return over the last month and a 14.44% gain over the past three months.
A significant point for IBCP is its Risk/Reward ratio, which stands at a very low 0.2. This ratio implies that the potential reward is significantly smaller than the potential risk, suggesting a less attractive risk-adjusted entry despite the strong technical signals and 100% confidence. Investors should carefully weigh the implications of such a low Risk/Reward ratio, as it indicates a relatively higher risk for a given potential return.
#5: MMM — 3M Company
3M Company (MMM) is highlighted with an OpportunityRadar Score of 64, driven by a technical score of 68 and a fundamental score of 58. The signal for MMM is a BUY, accompanied by a 100% confidence rating and a STRONG ENTRY designation. The stock is currently priced at $178.85. Technical analysis shows a strong RSI of 67.5 and a MACD in BULL territory, indicating positive price momentum. MMM has delivered robust short-term returns, with a 13.19% gain over the last month and a 25.23% increase over the last three months.
Similar to some other tickers on this list, MMM presents a relatively low Risk/Reward ratio of 0.3. While the technical strength and 100% confidence are compelling, this low ratio suggests that the potential upside may be limited compared to the associated risk. The RSI of 67.5, while not yet officially overbought (typically 70+), is on the higher side, suggesting that the stock has experienced a significant run-up in price recently.
#6: IQV — IQVIA Holdings, Inc.
IQVIA Holdings, Inc. (IQV) earns an OpportunityRadar Score of 64, with a technical score of 68 and a fundamental score of 58. The scanner indicates a BUY signal with an 83% confidence level, suggesting a strong, though not perfect, conviction. The entry point is rated as STRONG ENTRY. IQV is trading at $228.10. Its technical profile includes an RSI of 61.5 and a MACD in BULL territory. The stock has posted a 9.54% return over the last month and an impressive 29.29% gain over the last three months.
The Risk/Reward ratio for IQV is 1.0, which means the potential reward is equal to the potential risk. While this is a neutral ratio, it is more balanced than some of the lower ratios seen in other stocks on this list. The 83% confidence, while strong, is not at the 100% level, which could imply a slightly higher degree of uncertainty compared to the highest-conviction signals. However, the strong 3-month performance and bullish MACD remain positive indicators.
#7: NWS — News Corporation
News Corporation (NWS) is identified with an OpportunityRadar Score of 63, comprising a technical score of 66 and a fundamental score of 58. The scanner generates a BUY signal with a 100% confidence rating and a STRONG ENTRY point. NWS is currently priced at $31.96. Technical indicators show an RSI of 56.5 and a MACD in BULL territory, pointing to positive price action. The stock has delivered modest returns of 4.89% over the last month and 8.78% over the past three months.
The Risk/Reward ratio for NWS is 0.4, indicating that the potential reward is less than half the potential risk. Despite the 100% confidence and positive technical signals, this low ratio suggests that the risk-adjusted return profile may not be as attractive as some other opportunities. The relatively lower short-term returns compared to other high-confidence picks on the list also warrants consideration, even with the bullish MACD and healthy RSI.
#8: KNSA — Kiniksa Pharmaceuticals Intern
Kiniksa Pharmaceuticals Intern (KNSA) shows an OpportunityRadar Score of 63, with a technical score of 70 and a fundamental score of 53. The scanner issues a BUY signal with 100% confidence, indicating a STRONG ENTRY. KNSA is trading at $75.10. Its technical setup includes an RSI of 64.4 and a MACD in BULL territory, suggesting strong upward momentum. The stock has experienced robust price appreciation, with an 11.61% return over the last month and a substantial 32.36% gain over the past three months.
KNSA's Risk/Reward ratio is 1.0, which signifies a balanced outlook where potential reward is equivalent to potential risk. This neutral ratio, combined with the 100% confidence and strong technicals, paints a generally favorable picture. The stock's impressive three-month return of 32.36% further underscores its recent performance, suggesting sustained interest, though the lack of specific target or stop levels means this ratio provides a general guide rather than precise trading parameters.
#9: SHEL — Shell PLC
Shell PLC (SHEL) registers an OpportunityRadar Score of 63, with a technical score of 69 and a fundamental score of 55. The scanner indicates a BUY signal with an 83% confidence rating and a STRONG ENTRY point. SHEL is currently priced at $89.48. Technical indicators for SHEL include an RSI of 61.0 and a MACD in BULL territory. The stock has seen a 9.14% return over the last month, but its three-month return stands at a slight negative of -0.26%.
The divergence between SHEL's positive 1-month return and its slightly negative 3-month return is a key factor to consider. Despite the current BUY signal with 83% confidence and a bullish MACD, the negative three-month performance suggests that recent gains might be recovering from a prior dip or that momentum has been inconsistent. Furthermore, the Risk/Reward ratio of 0.3 indicates that the potential reward is significantly lower than the potential risk, which could be a concern for some investors.
#10: WKC — World Kinect Corporation
World Kinect Corporation (WKC) rounds out our top 10 with an OpportunityRadar Score of 63, featuring a technical score of 69 and a fundamental score of 53. The scanner has issued a BUY signal with a perfect 100% confidence, indicating a STRONG ENTRY. WKC is priced at $39.09. Its technical profile is particularly strong, with an RSI of 69.3 and a MACD in BULL territory. The stock has demonstrated exceptional performance, with an 18.03% return over the last month and a remarkable 41.48% gain over the past three months.
While WKC's performance and confidence are impressive, its RSI of 69.3 is approaching the conventional overbought threshold of 70. This elevated RSI suggests that the stock has experienced a rapid price increase, which could potentially lead to a short-term consolidation or pullback. Additionally, the Risk/Reward ratio of 0.5 implies that the potential reward is half the potential risk, which, combined with the high RSI, suggests a need for careful monitoring despite the strong BUY signal and returns.
Key Observations Across the Scan
- High Confidence Dominates: Seven out of the ten profiled tickers—LAD, SYBT, IBCP, MMM, NWS, KNSA, and WKC—received a 100% confidence rating for their BUY or STRONG BUY signals, indicating robust alignment across the OpportunityRadar's internal confirmation factors.
- Bullish Momentum Prevalent: A significant majority, nine out of ten tickers, displayed a MACD in BULL territory, suggesting strong positive momentum in their price trends. The only exception was PAYO.
- Strong Recent Returns: Several tickers exhibited impressive short-term performance, with PAYO leading the 3-month returns at 45.01%, followed by WKC (41.48%), KNSA (32.36%), IQV (29.29%), LAD (29.01%), and MMM (25.23%). For 1-month returns, LAD (18.59%) and WKC (18.03%) stood out.
- RSI Levels: The average RSI across these ten tickers is approximately 63.13, indicating a generally healthy upward trend. WKC had the highest RSI at 69.3, nearing overbought conditions, while NWS had the lowest at 56.5.
- Strong Entry Signals: Eight out of the ten tickers were flagged with a 'STRONG ENTRY' signal, reflecting favorable conditions for initiating positions according to the scanner's criteria.
Key Risk Factors
While the scan presents many positive signals, several factors warrant careful consideration:
- MACD Divergence in PAYO: Payoneer Global Inc. (PAYO) shows a MACD in BEAR territory despite receiving a BUY signal. This divergence, coupled with a 67% confidence rating (lower than many peers), suggests that while the stock has seen significant 3-month returns of 45.01%, its recent momentum may be turning negative, posing a potential risk.
- Low Risk/Reward Ratios: Several tickers, including IBCP (0.2), MMM (0.3), SHEL (0.3), NWS (0.4), SYBT (0.5), and WKC (0.5), exhibit Risk/Reward ratios significantly below 1.0. This indicates that the potential upside for these opportunities is less than the potential downside, suggesting a less favorable risk-adjusted profile despite strong BUY signals and high confidence in some cases. IBCP's 0.2 ratio is particularly low.
- Elevated RSI for WKC: World Kinect Corporation (WKC) has an RSI of 69.3. While not officially overbought (typically 70 or above), this level is high and indicates that the stock has experienced a substantial and rapid price increase. Such elevated RSI levels can sometimes precede a period of consolidation or a pullback, especially when combined with a lower Risk/Reward ratio of 0.5.
About Our Methodology
OpportunityRadar scans 6,600+ US stocks daily using 15+ technical indicators including RSI, MACD, Bollinger Bands, ADX, Aroon, support/resistance levels, and volume analysis, combined with fundamental metrics. Stocks are scored 0-100 with signals ranging from Accumulate to Strong Buy. Entry confidence is rated 50-100% based on 6 confirmation factors.
Disclaimer: This article is for informational purposes only and does not constitute financial advice. Past performance does not guarantee future results. Always conduct your own research and consult a qualified financial advisor before making investment decisions. Data as of August 04, 2026.
Related Articles

Disclaimer : The above information is for general informational purposes only. All information on the Site is provided in good faith, however we make no representation or warranty of any kind, express or implied, regarding the accuracy, adequacy, validity, reliability, availability or completeness of any information on the Site.