
10 Stocks with 100% Confidence Buy Signals — August 2026
Discover 10 top-scoring stocks, including Delta Air Lines (DAL) with an OpportunityRadar Score of 76, all showing 100% confidence BUY signals and MACD BULL indicators on August 07, 2026.
by Kowsalya
Published Aug 07, 2026 | Updated Aug 07, 2026 | 📖 11 min read
Article continues below advertisement
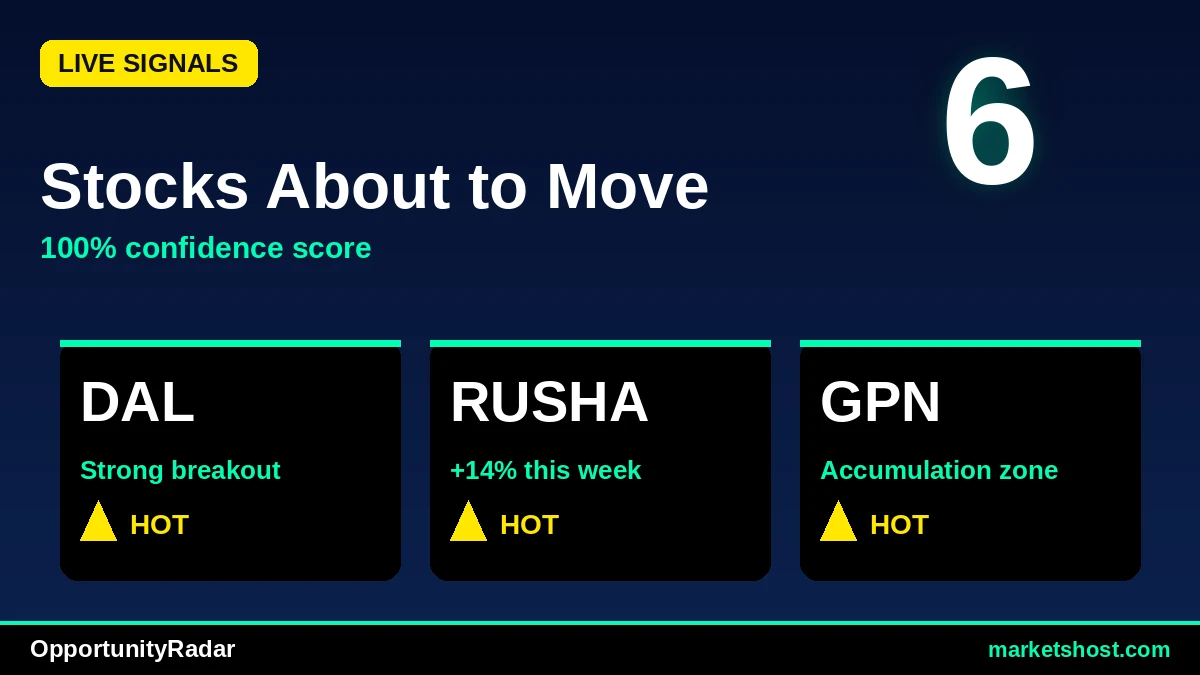
OpportunityRadar Spotlights 10 Strong Entry Buy Signals for August 2026
As trading continues into August 2026, the MarketsHost OpportunityRadar scan has identified a compelling list of 10 stocks exhibiting strong BUY signals with 100% confidence. Leading this selection is Delta Air Lines, Inc. (DAL), which registers the highest OpportunityRadar Score of 76. DAL's robust fundamental score of 90, combined with a technical score of 66, positions it at the forefront of today's scan, currently priced at $91.51.
Across the top 10 tickers highlighted by today's scan, a consistent theme of strong technical alignment emerges. All 10 stocks present a 'STRONG ENTRY' signal with 100% confidence, alongside a 'MACD BULL' indicator. The average Relative Strength Index (RSI) for these top performers stands at 60.82, indicating healthy momentum without venturing into overbought territory. Furthermore, five of these tickers have delivered over 10% returns in the last month, while six have seen gains exceeding 20% over the past three months, underscoring their recent upward trajectory.
Top 10 Signals at a Glance
| # | Ticker | Company | Price | Score | Confidence | RSI | MACD | 1-Month Return |
|---|---|---|---|---|---|---|---|---|
| 1 | DAL | Delta Air Lines, Inc. | $91.51 | 76 | 100% | 58.9 | BULL | 4.71% |
| 2 | RUSHA | Rush Enterprises, Inc. | $80.69 | 67 | 100% | 60.0 | BULL | 6.9% |
| 3 | GPN | Global Payments Inc. | $85.81 | 67 | 100% | 59.3 | BULL | 12.85% |
| 4 | MSBI | Midland States Bancorp, Inc. | $33.53 | 66 | 100% | 60.9 | BULL | 9.81% |
| 5 | IQV | IQVIA Holdings, Inc. | $235.4 | 65 | 100% | 64.0 | BULL | 13.25% |
| 6 | QUAD | Quad Graphics, Inc | $10.02 | 65 | 100% | 65.1 | BULL | 20.52% |
| 7 | SKYW | SkyWest, Inc. | $112.52 | 65 | 100% | 63.0 | BULL | 12.84% |
| 8 | CNH | CNH Industrial N.V. | $10.97 | 64 | 100% | 53.6 | BULL | 4.98% |
| 9 | EXPD | Expeditors International of Wa | $179.64 | 64 | 100% | 60.8 | BULL | 4.43% |
| 10 | CHEF | The Chefs' Warehouse, Inc. | $108.3 | 64 | 100% | 62.6 | BULL | 13.06% |
#1: DAL — Delta Air Lines, Inc.
Delta Air Lines, Inc. (DAL) leads today's OpportunityRadar scan with an impressive overall score of 76. The analysis shows a 'BUY' signal with 100% confidence and a 'STRONG ENTRY' recommendation at its current price of $91.51. Technical indicators are supportive, with the Relative Strength Index (RSI) at 58.9 and the Moving Average Convergence Divergence (MACD) indicating a 'BULL' trend. Over the past three months, DAL has delivered a substantial return of 24.79%, following a 4.71% gain in the last month.
DAL's high OpportunityRadar Score is underpinned by a strong fundamental component of 90, complementing its technical score of 66. While specific breakdowns for trend, momentum, volume, and risk scores are not provided, the 100% confidence rating suggests broad alignment across various confirmation factors. The Risk/Reward ratio for DAL stands at 0.4, indicating a particular risk profile that investors will consider in relation to the stock's recent performance and strong fundamental scoring.
#2: RUSHA — Rush Enterprises, Inc.
Rush Enterprises, Inc. (RUSHA) appears on the scan with an OpportunityRadar Score of 67, signaling a 'BUY' with 100% confidence and a 'STRONG ENTRY' at its current price of $80.69. The technical outlook for RUSHA includes an RSI of 60.0 and a 'MACD BULL' indication, reflecting positive price momentum. The stock has demonstrated a 6.9% return over the last month and an 11.59% gain over the past three months.
The overall score for RUSHA is composed of a technical score of 74 and a fundamental score of 56. Despite the strong technical indicators, the Risk/Reward ratio is noted at 0.4. This ratio provides insight into the potential reward relative to the risk involved. The consistent 100% confidence rating across the 'BUY' signal suggests a robust confirmation from the underlying methodology, even as detailed score breakdowns for individual components like trend or volume are not specified.
#3: GPN — Global Payments Inc.
Global Payments Inc. (GPN) is featured with an OpportunityRadar Score of 67, highlighting a 'BUY' signal at 100% confidence and a 'STRONG ENTRY' point at $85.81. The stock's technical posture is firm, with an RSI of 59.3 and a 'MACD BULL' signal. GPN has shown significant upward movement, posting a 12.85% return in the last month and an impressive 24.02% gain over the three-month period.
The scoring for GPN includes a technical score of 73 and a fundamental score of 58. The strong short-term and medium-term returns are a notable feature, indicating recent positive price action. With a Risk/Reward ratio of 0.6, the stock presents a specific risk profile. The 100% confidence in the 'BUY' signal underscores the strength of the combined technical and fundamental factors assessed by the OpportunityRadar methodology, despite the absence of specific detailed metrics for earnings or revenue growth.
#4: MSBI — Midland States Bancorp, Inc.
Midland States Bancorp, Inc. (MSBI) registers an OpportunityRadar Score of 66, accompanied by a 'BUY' signal with 100% confidence and a 'STRONG ENTRY' at its current price of $33.53. The technical analysis shows an RSI of 60.9 and a 'MACD BULL' signal, indicating positive momentum. MSBI has delivered solid returns, with a 9.81% increase over the last month and an 18.42% gain over the past three months.
The company's overall score is derived from a technical score of 74 and a fundamental score of 53. The Risk/Reward ratio for MSBI is 0.5, which provides a quantitative measure of potential returns relative to risk. The 100% confidence rating for the 'BUY' signal suggests that the underlying factors are strongly aligned, supporting the 'STRONG ENTRY' recommendation. While specific fundamental metrics like P/E and EPS are not provided, the fundamental score contributes to the overall positive assessment.
#5: IQV — IQVIA Holdings, Inc.
IQVIA Holdings, Inc. (IQV) is identified by the scan with an OpportunityRadar Score of 65, indicating a 'BUY' signal at 100% confidence and a 'STRONG ENTRY' at its price of $235.4. Technologically, IQV shows an RSI of 64.0 and a 'MACD BULL' signal. The stock has demonstrated robust performance, with a 13.25% return in the last month and a significant 31.72% gain over the past three months.
The OpportunityRadar Score for IQV is composed of a technical score of 69 and a fundamental score of 58. The sustained strong returns over both the one-month and three-month periods are a key characteristic of this signal. With a Risk/Reward ratio of 0.7, IQV presents a defined risk profile. The 100% confidence rating reinforces the strength of the 'BUY' signal, suggesting a confluence of positive technical and fundamental factors, even in the absence of detailed trend or momentum breakdown scores.
#6: QUAD — Quad Graphics, Inc
Quad Graphics, Inc (QUAD) earns an OpportunityRadar Score of 65, accompanied by a 'BUY' signal at 100% confidence and a 'STRONG ENTRY' at $10.02. Technical indicators are particularly strong, with an RSI of 65.1 and a 'MACD BULL' signal. QUAD has been a notable performer, achieving a 20.52% return in the last month and an impressive 34.25% gain over the past three months, making it the highest 1-month and 3-month gainer among the top 10.
The overall score for QUAD is supported by a technical score of 73 and a fundamental score of 53. Its Risk/Reward ratio stands at 1.1, which is the highest among the top 10 profiled tickers, indicating a specific balance between potential gains and associated risks. The 100% confidence rating for the 'BUY' signal suggests a strong alignment of factors contributing to the positive outlook, despite the limited availability of specific fundamental data points like P/E or earnings growth.
#7: SKYW — SkyWest, Inc.
SkyWest, Inc. (SKYW) is highlighted with an OpportunityRadar Score of 65, signaling a 'BUY' with 100% confidence and a 'STRONG ENTRY' at its current price of $112.52. The technical analysis for SKYW shows an RSI of 63.0 and a 'MACD BULL' signal, indicating positive momentum. The stock has delivered strong returns, with a 12.84% gain in the last month and a 27.53% increase over the past three months.
SKYW's OpportunityRadar Score is composed of a technical score of 71 and a fundamental score of 56. The consistent upward movement in both the short and medium term underscores the stock's recent performance. The Risk/Reward ratio is 0.5, providing a quantitative measure of the stock's risk profile. The 100% confidence rating for the 'BUY' signal suggests a robust confirmation from the scanning methodology, even without specific breakdown scores for trend or volume.
#8: CNH — CNH Industrial N.V.
CNH Industrial N.V. (CNH) registers an OpportunityRadar Score of 64, with a 'BUY' signal at 100% confidence and a 'STRONG ENTRY' at $10.97. Technical indicators show an RSI of 53.6, which is the lowest among the top 10, and a 'MACD BULL' signal. CNH has seen a 4.98% return over the last month, with a modest 0.09% gain over the past three months.
The overall score for CNH is supported by a technical score of 68 and a fundamental score of 58. The Risk/Reward ratio is 1.0, indicating that the potential reward is equal to the risk. While the three-month return is relatively flat compared to other top signals, the 100% confidence rating for the 'BUY' signal suggests that the current technical and fundamental alignment is strong, warranting a 'STRONG ENTRY' assessment. The absence of specific P/E or earnings growth data means the fundamental assessment relies on the aggregated score.
#9: EXPD — Expeditors International of Wa
Expeditors International of Wa (EXPD) appears on the scan with an OpportunityRadar Score of 64, signaling a 'BUY' with 100% confidence and a 'STRONG ENTRY' at its current price of $179.64. Technical analysis shows an RSI of 60.8 and a 'MACD BULL' signal, indicating positive momentum. The stock has delivered a 4.43% return over the last month and a 14.65% gain over the past three months.
EXPD's OpportunityRadar Score is based on a technical score of 68 and a fundamental score of 58. The Risk/Reward ratio is 0.5, providing insight into the potential reward relative to the risk involved. The 100% confidence rating for the 'BUY' signal indicates a robust confirmation from the underlying methodology, even though specific detailed metrics for earnings or revenue growth are not provided in this scan. The consistent 'MACD BULL' signal further supports the positive technical outlook.
#10: CHEF — The Chefs' Warehouse, Inc.
The Chefs' Warehouse, Inc. (CHEF) concludes our top 10 list with an OpportunityRadar Score of 64, featuring a 'BUY' signal with 100% confidence and a 'STRONG ENTRY' at $108.3. Technical indicators are strong, with an RSI of 62.6 and a 'MACD BULL' signal. CHEF has demonstrated robust performance, with a 13.06% return in the last month and a substantial 32.54% gain over the past three months.
The overall score for CHEF is composed of a technical score of 69 and a fundamental score of 56. The strong short-term and medium-term returns are a significant factor in its inclusion on this list. The Risk/Reward ratio for CHEF is 0.8, providing a quantitative measure of its risk profile. The 100% confidence rating for the 'BUY' signal suggests a strong alignment of factors contributing to the positive assessment, despite the absence of specific fundamental metrics like P/E or EPS growth.
Key Observations Across the Scan
The August 07, 2026 OpportunityRadar scan reveals several consistent patterns across the top 10 identified tickers. All 10 stocks generated a 'BUY' signal with 100% confidence and a 'STRONG ENTRY' recommendation, indicating a high degree of alignment across the underlying analytical factors. Furthermore, every one of these 10 tickers displayed a 'MACD BULL' signal, suggesting positive momentum is a pervasive characteristic among this selection.
In terms of performance, the average OpportunityRadar Score for these 10 stocks is 66.3, with an average technical score of 70.5 and an average fundamental score of 59.6. The average RSI across the group is 60.82, well within the typical range for healthy momentum without being overextended. Five of the 10 tickers, including Global Payments Inc. (GPN), IQVIA Holdings, Inc. (IQV), Quad Graphics, Inc (QUAD), SkyWest, Inc. (SKYW), and The Chefs' Warehouse, Inc. (CHEF), registered one-month returns exceeding 10%. Looking at the longer term, six tickers — Delta Air Lines, Inc. (DAL), Global Payments Inc. (GPN), IQVIA Holdings, Inc. (IQV), Quad Graphics, Inc (QUAD), SkyWest, Inc. (SKYW), and The Chefs' Warehouse, Inc. (CHEF) — showed three-month returns above 20%.
Key Risk Factors
While the scan highlights strong BUY signals, several factors from the data warrant consideration. Firstly, the Risk/Reward ratios for many of these top 10 tickers are relatively low, with Delta Air Lines (DAL) and Rush Enterprises (RUSHA) both at 0.4, and Midland States Bancorp (MSBI), SkyWest (SKYW), and Expeditors International (EXPD) at 0.5. These low ratios suggest that the potential upside may be limited relative to the identified risk, which is a crucial aspect for investors to evaluate.
Secondly, the scanner data indicates that several detailed technical indicators, such as ADX, Stochastic Oscillator, and Bollinger Bands, are not available ('N/A') for these tickers. Similarly, specific support and resistance levels are not provided. This absence of granular technical data could limit the ability to conduct a more in-depth technical analysis beyond the RSI and MACD signals presented in the scan.
Finally, a comprehensive set of fundamental metrics, including P/E ratio, EPS, Debt/Equity, and specific earnings and revenue growth percentages, are also marked as 'N/A' across all profiled stocks. While an overall fundamental score is provided, the lack of these individual data points restricts a detailed fundamental assessment, requiring investors to rely more heavily on the aggregated fundamental score and the available technical indicators.
About Our Methodology
OpportunityRadar scans 6,600+ US stocks daily using 15+ technical indicators including RSI, MACD, Bollinger Bands, ADX, Aroon, support/resistance levels, and volume analysis, combined with fundamental metrics. Stocks are scored 0-100 with signals ranging from Accumulate to Strong Buy. Entry confidence is rated 50-100% based on 6 confirmation factors.
Disclaimer: This article is for informational purposes only and does not constitute financial advice. Past performance does not guarantee future results. Always conduct your own research and consult a qualified financial advisor before making investment decisions. Data as of August 07, 2026.
Related Articles



Disclaimer : The above information is for general informational purposes only. All information on the Site is provided in good faith, however we make no representation or warranty of any kind, express or implied, regarding the accuracy, adequacy, validity, reliability, availability or completeness of any information on the Site.